
Posts Tagged: phosphorous
Announcing a Meeting on January 30 on Strawberry Mineral Nutrition
This post is to announce a meeting on strawberry mineral nutrition to take place this coming January 30. I think it might be good to spend a little bit of time on the current salt situation as well, seeing as it is related to nutrition and water.
First presentation will be in Spanish, and the second in English, with translation provided for both.
Growers and PCA's - bring a copy soil and/or tissue sample analysis for review of sufficiencies/deficiencies/toxicities in our final exercise.
Look forward to seeing you there!
MG156
The Deal with Phosphite Fertilizers
Here is another interesting aspect of plant nutrition drawn from the October 23 Soil Fertility Short Course at UC Davis.
Phosphorous (P), an essential element for plants, does not occur alone in nature and rather it combines with oxygen and hydrogen. Bonded with four oxygen atoms P makes phosphate, and when bonded with three atoms of oxygen and one atom of hydrogen, P forms phosphite.
The fully oxidized phosphate (the one with four oxygen atoms) is the most stable form of P in the environment, and is preferentially taken up by microbes and plant roots. Then again, phosphate is adsorbed to soil particles more than phosphite, meaning it is less available. However, it does not necessarily follow that this enhanced availability of P via phosphite results in more uptake by plants, but even so, fertilizer formulations of phosphite plus calcium, magnesium or potassium have been formulated with the intent of taking advantage of this greater solubility in the soil.
Several studies examining a greater availability of P through phosphite have found that when phosphite is applied at an equivalent rate of P to phosphate fertilizer, it consistently underperformed when measured in terms of crop productivity, especially in the first year of cropping. In the way of explanation, the slower oxidation process of phosphite to the plant-root preferred phosphate, may be part of the equation of why the phosphite is not as effective as phosphate, in spite of having greater mobility.
In lay terms we can say, yes, phosphite might more available to plants in the soil, but they don’t want it as much as they want phosphate.
On the other hand, foliar applications of phosphite have shown that, while it can be converted to phosphate on the leaves by microbes living there, it is more readily absorbed into the foliage of some crop plants like citrus and avocados. Phosphite application (usually once at pre-bloom and perhaps a second time later in the season) to the foliage of avocados or oranges has resulted in more flowers, greater fruit yield and size, total soluble solids and anthocyanin concentrations.
For further reading, see the paper below, which among other things implies that the positive results experienced in oranges and avocados could be replicated in berries…
http://www.spectrumanalytic.com/support/library/pdf/Phosphite_Fertilizers_What%20are%20they.pdf
Leaf Purpling on Red Raspberry
Here is an interesting case regarding a slight purpling of the newer leaves of raspberry. While the case below involves ‘Polka’ variety red raspberry, I’ve seen it this year on ‘Josephine’ red raspberry in a different field as well.
The question posed is whether this purpling is meaningful from a plant health standpoint. Will this problem get worse and detract from yield and cause problems with next years crop?
For starters, there is are no disease symptoms, for example necrotic spots or goo seeping out out of the leaves or stems, nor are there any signs of disease, such as spores or conidial structures visible.
We should consider also possible side effects of insecticide or fungicide sprays. I do recall once in a trial on the strawberry variety ‘Diamante’ that repeated applications of a strobilurin fungicide such as Pristine or Quadris resulted in a similar pattern of purpling on the leaves. However in this case on ‘Polka’, the PCA in charge of this field confirmed with me that Pristine had been applied after the symptoms appeared, and this is only one application of the material. There was only one other pesticide application previous to this one, and it was more than a month ago.
What about nutrient deficiency? A simple application of what we know from nutrient deficiency books would inform us that the purpling we see here refers to some sort of phosphorous deficiency, but other nutrients can cause this too. Furthermore, those having more than a passing knowledge of the agricultural soils in the Pajaro and Salinas valleys know they are rarely phosphorous deficient, and more often than not actually have an excess of this nutrient.
Which brings us to nitrogen. Nitrogen, while commonly associated with yellowing rather than purpling of leaves, leaches out of the soil easily and as such can be deficient even in the rich soils of the California central coast. As we know, nitrogen deficiencies can be manifested in plants as a reddening or purpling of the leaves stemming from an accumulation of the same carbohydrates resulting from phosphorous deficiency.
The only way we are going to know if the above has any truth to it at all however is to take some leaf samples. The chart below is from a bulk sample consisting of at least twenty leaves, each taken from around the fifth leaf of the plant (note that this is a bit younger than the seventh leaf common for sampling, but the purpling was only found at this stage and younger).
Samples were analyzed by the Soil Control Lab in Watsonville.
|
Nutrient |
Purple leaves |
Green leaves |
|
Total Nitrogen |
2.4% |
2.6% |
|
Total Phosphorous |
0.28% |
0.29% |
|
Total Potassium |
1.3% |
1.1% |
|
Calcium |
1.3% |
1.8% |
|
Magnesium |
0.53% |
0.65% |
|
Total Sulfur |
0.2% |
0.2% |
|
Copper |
6.1ppm |
7.5 ppm |
|
Zinc |
26 ppm |
26 ppm |
|
Iron |
220 ppm |
260 ppm |
|
Manganese |
210 ppm |
190 ppm |
|
Boron |
46 ppm |
60 ppm |
|
Molybdenum |
3.6 ppm |
5.4 ppm |
The chart above shows us that for one there are no dramatic differences between in nutrient concentrations of green leaves compared to those which are purple. On the other hand, concentrations of nitrogen, phosphorous and potassium are trending just a tad low, with perhaps the nitrogen being the most significant especially since the sampled leaves were on the young side.
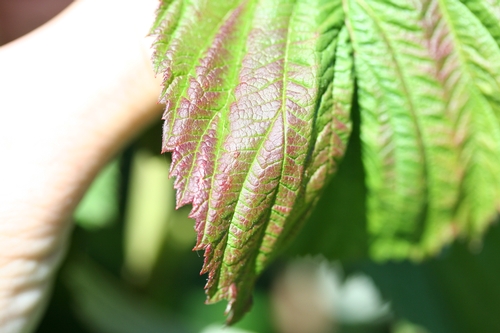
Foliar purpling of 'Polka' variety red raspberry
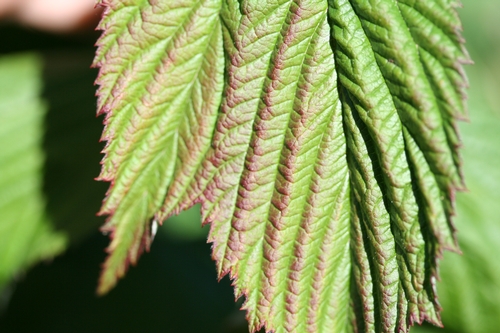
Foliar purpling of 'Polka' variety red raspberry
Testing the Effectiveness in Strawberry of Phosphorous Fertilizer Additions in High Phosphorous Concentration Soils.
Some points to ponder on a rainy few days regarding phosphorous fertility in strawberries.
Since the work described below was conducted both years in a soil of or above 80 ppm phosphorous, we can’t define where the agronomic threshold for crop response from additional phosphorous lies and subsequently can’t publish in a peer reviewed journal. Subsequently this is not meant to be a guide for phosphorous fertility in California strawberries. Nevertheless, since many of the soils we farm are well within the concentrations of P described, this work could be instructive to those thinking about soil fertility in strawberries.
Introduction: There is a significant body of work in lettuce and several other vegetable crops on the California Central which finds that above a certain soil test threshold concentration there is no longer any plant response to any added phosphorous (P). The following two year study was designed to approach the hypothesis that this also holds true for strawberries.
Materials and Methods:
Year 1 (2008-2009): The field for the study in year one was located south of Salinas and had the following characteristics:
|
OM |
Sand |
Silt |
Clay |
PPM Olsen P |
|
2.5% |
49 |
26 |
25 |
90 |
The area for experiment had 24-0-15 added on 9/23/08 at the rate of 362 lb/A applied. Plots to contain phosphorous had super phosphate applied to them at the rate of 48 lb P/A.
Supplemental fertilizer applications to trial plots through the season were in total the equivalent of 54.7 lb N, 60 lb P, and 60 lb K and were achieved with applications of 3-18-18, 20-20-20, and ammonium sulfate.
Yield data for marketable and cull fruit was taken once a week beginning April 7 and ending September 16. As soil phosphorous levels do not change rapidly even in the presence of a crop, soil data for phosphorous concentration was taken once from the field before trial placement and then on August 24, 2009, and plant tissue data consisting of petioles and blades was taken once a month beginning in January, 2009.
Year 2 (2009-2010):
Field for year 2 was near to the field for year 1, so initial soil characteristics were similar.
The area for the experiment had 325 lb/A of 27-0-18 applied to the plots free of phosphorous addition and 24-8-18 at an equivalent rate to the above applied to plots with phosphorous. The result for pre-plant fertilizer addition then was 78 lb N, 26 lb P, and 49 lb K applied to phosphorous addition plots and the same amount of nitrogen and potassium applied to plots without added phosphorous.
Supplemental fertilizer applications to trial plots through the beginning of September were in total the equivalent of 172 lb N, 0 lb P and 12 lb K and were achieved with applications of CN9, 0-0-25, and UN32.
Yield data for marketable and cull fruit was taken once a week beginning April 30 and ending September 2. Soil data was taken once a month starting in October, 2009 and no samples taken in June or July of 2010. Plant tissue data consisting of whole leaf blade nutrient concentrations was taken April, May, August and September.
Results- Year 1
Fruit Yield: There were no significant differences in marketable fruit yield or number in any month sampled, nor were there any significant differences in yields and numbers of cull fruit.
Blade and petiole information given below is a summary of the data sampled over the course of the first year of this study. There are no significant differences by date between plots with P added and those with no P added.
Petioles by sampling date
|
|
NO3 ppm |
PO4 ppm |
%K |
|
3/2/2009 |
|
|
|
|
P added |
2295 |
2000 |
2.45 |
|
No P added |
2310 |
2035 |
2.55 |
|
5/1/2009 |
|
|
|
|
P added |
2576 |
1830 |
2.71 |
|
No P added |
2692 |
1690 |
2.56 |
|
8/24/2009 |
|
|
|
|
P added |
1237.5 |
1657.5 |
2.01 |
|
No P added |
1137.5 |
1690.0 |
1.89 |
Blades by sampling date
|
|
%N |
%P |
%K |
|
1/13/2009 |
|
|
|
|
P added |
3.52 |
0.74 |
2.31 |
|
No P added |
3.54 |
0.64 |
2.21 |
|
3/2/2009 |
|
|
|
|
P added |
3.62 |
0.84 |
2.06 |
|
No P added |
3.67 |
0.89 |
2.10 |
|
5/1/2009 |
|
|
|
|
P added |
2.87 |
0.41 |
1.71 |
|
No P added |
2.90 |
0.39 |
1.81 |
|
8/24/2009 |
|
|
|
|
P added |
2.64 |
0.36 |
1.76 |
|
No P added |
2.63 |
0.35 |
1.69 |
Field soil phosphorous was 90 ppm as per Olsen’s P before trial placement and average readings were 85 ppm from plots with additional phosphorous added, and 87 ppm from plots where no phosphorous was added. These readings are not significantly different from one another.
Results- Year 2
Fruit yield: There were no significant differences in marketable fruit yield or number in any month sampled, nor were there any significant differences in total yield of cull fruit or number.
Blade and soil nutrient information given below is a summary of the data sampled over the course of the second year of this study. Unless indicated so, there are no significant differences between plots with P added and those with no P added by date.
Blades by sampling date
|
|
%N |
%P |
%K |
|
4/8/2010 |
|
|
|
|
P added |
2.58 |
0.56 |
1.6 |
|
No P added |
2.62 |
0.55 |
1.6 |
|
5/27/2010 |
|
|
|
|
P added |
2.72 |
0.36 |
1.56 |
|
No P added |
2.74 |
0.37 |
1.54 |
|
8/10/2010 |
|
|
|
|
P added |
2.46 |
0.34 |
1.38 |
|
No P added |
2.50 |
0.34 |
1.41 |
Soil by sampling date
|
|
NO3 ppm |
Olsen P |
K ppm |
|
4/8/2010 |
|
|
|
|
P added |
16.35 |
85 |
179.3 |
|
No P added |
16.15 |
83 |
175.8 |
|
5/27/2010 |
|
|
|
|
P added |
10.50 |
86 |
170.3 |
|
No P added |
3.51 |
76 * |
182.9 |
|
8/10/2010 |
|
|
|
|
P added |
9.73 |
84 |
106.4 |
|
No P added |
9.91 |
82 |
125.5 |
* Significantly differs (P=0.05, Student Newman Kuels)
Comments and Discussion: It is clear that the addition of phosphorous in this study covering two years of distinct strawberry crops did not result in yield differences, nor in plant tissue concentrations.
That soil P values did not decline very much, if at all, in both years should not be surprising. For one, the soil test value is a measure of the soil P equilibrium, which means that when plants remove P from the soil solution, additional P comes into the solution from precipitated forms. In other words, a soil with a high P test like the one in these tests simply backfills what is taken up by the plant from its ample reserve. Secondly, according to sampling done by Tim Hartz and his lab over the past few years, we have no indication that strawberries are removing more than 40 lb P per acre per season, meaning that soil test P would not decline more than 15 ppm even if no more P were to come into solution as described above. It simply will not fall very much.
Many thanks to Tim Hartz at UC Davis and the DANR Analytical Laboratory at Davis for their dedicated assistance with this work.
Finally, I want to thank the grower who collaborated with me on this work for two years. You know who you are, and you helped me a lot- I wouldn’t have been able to even think about doing this study if you hadn’t helped me so much. Thank you!
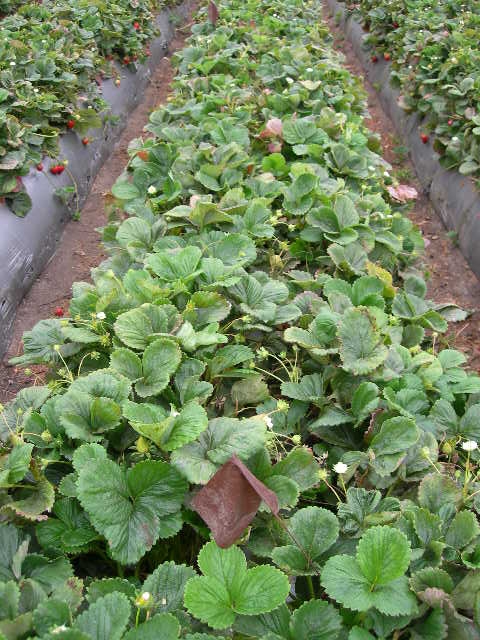
Phosphorous fertilizer added plot, mid August 2009
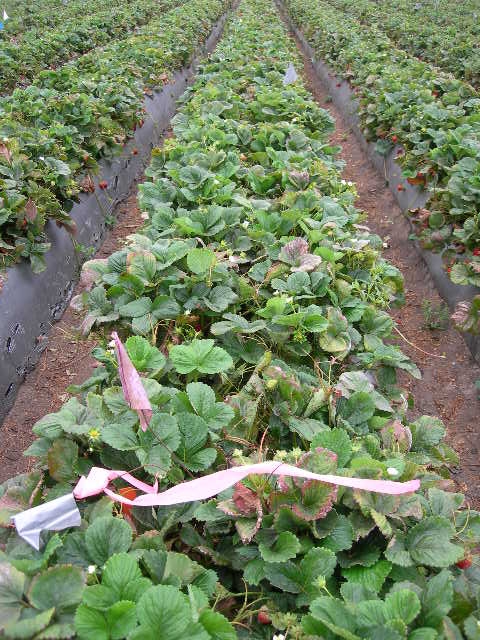
No added phosphorous fertilizer plot, mid August 2009
Strawberry Plant Nutrient Sufficiency Levels Revised
It has been more than 30 years since UC published strawberry leaf nutrient diagnostic guidelines (Publication 4098, ‘Strawberry deficiency symptoms: a visual and plant analysis guide to fertilization’, released in 1980). In the years since that publication, varieties, production practices and yield expectations have changed considerably. In 2010 we began a project, funded by the California Strawberry Commission, to reevaluate leaf and petiole nutrient sufficiency ranges for day-neutral strawberries. With the cooperation of many berry growers in the Watsonville-Salinas and Santa Maria areas we collected leaf and petiole samples from more than 50 ‘Albion’ fields over the past two production seasons. In each field samples were collected 5 times over the production season, from early spring through September, to document the nutrient concentration trends from pre-fruiting to post-peak production. Leaf samples were analyzed for total concentration of nitrogen (N), phosphorus (P), potassium (K), calcium (Ca), magnesium (Mg), sulfur (S), zinc (Zn), manganese (Mn), iron (Fe) and copper (Cu). Petioles were analyzed for NO3-N, PO4-P and K concentration.
After the season cooperating growers provided yield information, which allowed us to categorize the fields as being ‘high yield’ or 'low yield’. We then applied a process called DRIS (Diagnosis and Recommendation Integrated System) to mathematically evaluate the difference in nutrient concentrations as well as nutrient ratios between high yield and low yield fields. This process allowed us to identify which of the high yield fields were ideally balanced nutritionally. From this group of nutritionally balanced, high yield fields we were able to calculate a DRIS sufficiency range for each nutrient at each growth stage.
Fig. 1 shows that leaf N, P and K concentrations were highest before harvest began (stage 1, which was late February in Santa Maria and late March in Watsonville-Salinas), and declined to a reasonably stable level throughout the main harvest period (stages 3-5, May-July in Santa Maria, June-August in Watsonville-Salinas). The decline in leaf macronutrient concentrations during the peak harvest period was expected; it happens in many fruiting crops because the leaves rapidly translocate nutrients to the developing fruit. By contrast, micronutrient concentrations either increased from early vegetative growth to the main harvest period (as was the case for B, Ca and Fe), or remained reasonably stable over the entire season (all other micronutrients). The vertical bars on each data point on Fig. 1 indicate the range of values typical of nutritionally balanced, high yield fields at each growth stage. These are the DRIS sufficiency ranges; leaf nutrient concentrations within these ranges can safely be assumed to be adequate for high yield production.
Table 1 lists the DRIS leaf nutrient sufficiency ranges for pre-harvest and main harvest growth stages. For the sake of comparison, both the sufficiency ranges given in UC Publication 4098 and the current University of Florida guidelines have been included. Although for most nutrients the ranges match pretty well, for others there are substantial differences. Where the DRIS sufficiency range is substantially higher than the other sources (Ca, Mn and Fe, for example) it is because those nutrients are in such abundant supply in our coastal soils that plant uptake is far in excess of actual plant requirement; for those nutrients a lab test result marginally below the DRIS range would not be a matter of concern.
For several nutrients (N, Zn and Cu) the DRIS sufficiency range fell below the other recommendations. We are confident that the DRIS ranges represent nutrient sufficiency because they were determined by measuring the levels common in high yield fields. The field survey approach used in this project ensured that a wide range of field conditions and grower practices were included, so the results are broadly representative of the coastal industry. Also, for all three nutrients the average leaf concentrations of the high yield and low yield groups were essentially equal, suggesting that availability of these nutrients did not limit yields.
Fig. 2 shows the trends in petiole nutrient concentrations over the season. Petiole NO3-N was so highly variable as to be nearly worthless as a diagnostic technique; during peak fruit harvest (our sampling dates 3 and 4) petiole NO3-N in high yield fields varied from < 200 PPM to 2,600 PPM. While we believe that leaf total N is a more reliable measurement, this study suggests that maintaining petiole NO3-N > 1,000 PPM pre-harvest, and > 400 PPM during peak harvest, is adequate to maintain high productivity. Given the high variability of petiole NO3-N it is possible that concentrations < 400 PPM would be adequate during the summer.
Petiole PO4-P and K were less variable than petiole NO3-N. Maintaining PO4-P > 1,200 PPM throughout the season should ensure P sufficiency. Given the high soil P availability in most coastal soils rotated with vegetable crops, this level is probably much higher than the ‘critical value’. Maintaining petiole K > 2.5% preharvest, and > 1.5% during peak harvest, appears to be adequate.
Table 1. Comparison of DRIS leaf nutrient sufficiency ranges with prior UC recommendations, and current University of Florida guidelines.
|
|
|
Nutrient sufficiency ranges |
||
|
Growth stage |
Nutrient |
DRIS |
UC Pub. 4098 |
University of Florida |
|
Pre-harvest |
% N |
3.1 - 3.8 |
|
3.0 - 3.5 |
|
|
% P |
0.50 - 0.90 |
|
0.20 - 0.40 |
|
|
% K |
1.8 - 2.2 |
|
1.5 - 2.5 |
|
|
% Ca |
0.6 - 1.3 |
|
0.4 - 1.5 |
|
|
% Mg |
0.33 - 0.45 |
|
0.25 - 0.50 |
|
|
% S |
0.19 - 0.23 |
|
0.25 - 0.80 |
|
|
PPM B |
31 - 46 |
|
20 - 40 |
|
|
PPM Zn |
13 - 28 |
|
20 - 40 |
|
|
PPM Mn |
75 - 600 |
|
30 - 100 |
|
|
PPM Fe |
70 - 140 |
|
50 - 100 |
|
|
PPM Cu |
3.3 - 5.8 |
|
5 - 10 |
|
|
|
|
|
|
|
Main harvest |
% N |
2.4 - 3.0 |
> 3.0 |
2.8 - 3.0 |
|
|
% P |
0.30 - 0.40 |
0.15 - 1.30 |
0.20 - 0.40 |
|
|
% K |
1.3 - 1.8 |
1.0 - 6.0 |
1.1 - 2.5 |
|
|
% Ca |
1.0 - 2.2 |
0.4 - 2.7 |
0.4 - 1.5 |
|
|
% Mg |
0.28 - 0.42 |
0.3 - 0.7 |
0.20 - 0.40 |
|
|
% S |
0.15 - 0.21 |
> 0.10 |
0.25 - 0.80 |
|
|
PPM B |
40 - 70 |
35 - 200 |
20 - 40 |
|
|
PPM Zn |
11 - 20 |
20 - 50 |
20 - 40 |
|
|
PPM Mn |
65 - 320 |
30 - 700 |
25 - 100 |
|
|
PPM Fe |
85 - 200 |
50 - 3,000 |
50 - 100 |
|
|
PPM Cu |
2.6 - 4.9 |
3 - 30 |
5 - 10 |
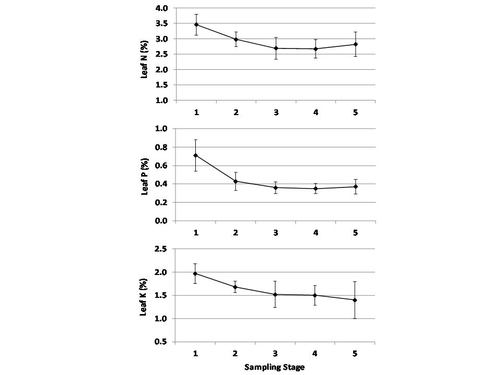
Fig. 1. Trend in leaf macronutrient concentrations over the growing season in nutritionally balanced, high yield fields; the bars indicate the DRIS sufficiency ranges.
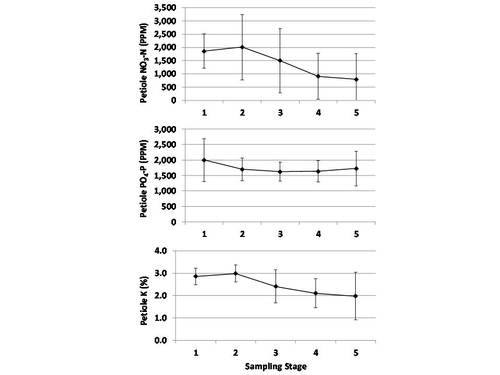
Fig. 2. Trend petiole macronutrient concentrations over the growing season in nutritionally balanced, high yield fields; the bars indicate the DRIS sufficiency ranges.
