
Posts Tagged: fertilizer
Is Miracle Gro a Viable Alternative for Fertility in Strawberry?
This question was floated at our recent Plant Nutrient lunch. In view of the fact that Miracle Gro is such a great fertilizer in home gardens and similar settings, would it be worth the while to use it in strawberries? Excellent solubility, fast plant response, good concentrations of the macronutrients and a complete diet of micronutrients to boot.
Going to the 2011 Cost and Return study for strawberries, we see that total nitrogen use for strawberries is 140 lbs, consisting of 500 lbs of 18-8-13 slow release and another 350 lbs of CAN17 (by the way this is NOT a recommendation for fertilizer use in strawberries, these two materials are simply to be used as a general guide to obtain cost information). In order to obtain the same level of nitrogen out of Miracle Gro (24-8-16), we would need to use 625 lbs which, since it is a soluble fertilizer, would be injected through the drip tape and spread over the life of the crop.
Total cost of 18-6-13 pre-plant and CAN17 works out to be $488, or 1% of the total operating cost per acre to produce strawberries. Miracle Gro, on the other hand, retails for $20 per 10 lb carton on Amazon (checked Alibaba, more expensive at $11.55 - 13.55 per 5 lb carton, minimum 40 carton pallet out of Malaysia from what seemed to be sort of a sketchy operation), meaning our total cost would be $1166 (0.24 x 583 lbs = 140 lbs; 583 lbs x $2 per lb = $1,166) or 4% of the total operating cost for an acre of berries.
It is hard to believe that the plant response to Miracle Gro, even if markedly improved over current practices, will make it anything worth the near 3x rise in cost, so it is probably not worth the while to pursue this idea any further.

What about Miracle Gro as a fertilizer for strawberries?
What Does Cheap Natural Gas do for California Berry Growers?
So what does cheap natural gas do for California berry growers? Not a lot apparently, if one extrapolates from an excellent article written by Colin Carter and Kevin Novan and recently released by the Giannini Foundation of Agricultural Economics titled “Shale Gas Boom: Implications for California Agriculture.”
http://giannini.ucop.edu/media/are-update/files/articles/V16N3_1_1.pdf
As most Americans know by now, the ability to access through hydraulic fracturing (known in the common parlance as “fracking”) previously unavailable shale gas resources portends an big shift in the energy dynamics of the United States.
The enormous amounts of shale gas becoming available through fracking in the US has brought about a drop in the price of natural gas nationwide, but this has not been followed with a worldwide drop in natural gas prices. Natural gas, moved as a gas through pipelines domestically, can only be transported to overseas markets once it has been converted to liquefied natural gas (LNG) at facilities where the gas is turned into liquid form and then pumped into tankers for transit. The current lack of such facilities in the US and subsequent difficulty to get our natural gas to foreign markets has resulted in huge price discrepancies globally, with natural gas prices in the US at approximately $3.30 per thousand cubic feet, at the same time in Europe for example prices are $12 per thousand cubic feet.
This price discrepancy of course presents a real cost advantage for users of energy and natural gas in the US over their overseas competitors. How much of this price advantage accrues to California berry growers is a question worth examination.
According to the article cited above, only 0.8% of total natural gas consumption in the US occurs in the agricultural sector. A lot of farm equipment, from tractors to motorized implements to trucks, use gasoline or diesel rather than natural gas. Obviously, if a lot of this equipment were to be converted to use natural gas there would be some cost advantage, but this is very much a proposition for the long term.
On the other hand, natural gas is the main input in the production of ammonia, which is subsequently converted to the nitrogen fertilizers which are a mainstay of California berry growers, who use anywhere between 160 to 250 lbs of the stuff per acre. However, fertilizer costs in the berry industry, according the UCCE Cost and Return studies make up only 1% percent of the total cost of production, meaning that price changes in nitrogen fertilizer are not that meaningful in one direction or another to the total cost of running a berry operation. Furthermore, fertilizer prices are arbitraged internationally, meaning prices tend not to vary too much from country to country, so low fertilizer costs stemming from cheap natural gas feedstock in the USA don’t really translate to much of a cost advantage to local growers anyway.
The other possibility where cheap natural gas prices could confer an advantage to California berry growers would be a reduction in the price of electricity, more than half of which in California is generated from natural gas. The heavy reliance on irrigation and the use of electricity to get that water out of the ground in California agriculture and the berry business at least superficially points to some savings from reduced energy costs. However, digging into our latest Cost and Return studies, pumping irrigation water constitutes only about 1.5% percent of the total cost of production of berries. The gains from cheaper gas and subsequently cheaper electricity will be not that significant in other words.
In conclusion, the increasing amounts of shale gas becoming available through fracking in the US, while offering some possibility of advantage over the long haul in terms of energy inputs for traction and transport, does not appear to give a lot of advantage currently to California berry growers over their foreign competitors in terms of cost of production.
How much will cheap natural gas help California berry growers?
Testing the Effectiveness in Strawberry of Phosphorous Fertilizer Additions in High Phosphorous Concentration Soils.
Some points to ponder on a rainy few days regarding phosphorous fertility in strawberries.
Since the work described below was conducted both years in a soil of or above 80 ppm phosphorous, we can’t define where the agronomic threshold for crop response from additional phosphorous lies and subsequently can’t publish in a peer reviewed journal. Subsequently this is not meant to be a guide for phosphorous fertility in California strawberries. Nevertheless, since many of the soils we farm are well within the concentrations of P described, this work could be instructive to those thinking about soil fertility in strawberries.
Introduction: There is a significant body of work in lettuce and several other vegetable crops on the California Central which finds that above a certain soil test threshold concentration there is no longer any plant response to any added phosphorous (P). The following two year study was designed to approach the hypothesis that this also holds true for strawberries.
Materials and Methods:
Year 1 (2008-2009): The field for the study in year one was located south of Salinas and had the following characteristics:
|
OM |
Sand |
Silt |
Clay |
PPM Olsen P |
|
2.5% |
49 |
26 |
25 |
90 |
The area for experiment had 24-0-15 added on 9/23/08 at the rate of 362 lb/A applied. Plots to contain phosphorous had super phosphate applied to them at the rate of 48 lb P/A.
Supplemental fertilizer applications to trial plots through the season were in total the equivalent of 54.7 lb N, 60 lb P, and 60 lb K and were achieved with applications of 3-18-18, 20-20-20, and ammonium sulfate.
Yield data for marketable and cull fruit was taken once a week beginning April 7 and ending September 16. As soil phosphorous levels do not change rapidly even in the presence of a crop, soil data for phosphorous concentration was taken once from the field before trial placement and then on August 24, 2009, and plant tissue data consisting of petioles and blades was taken once a month beginning in January, 2009.
Year 2 (2009-2010):
Field for year 2 was near to the field for year 1, so initial soil characteristics were similar.
The area for the experiment had 325 lb/A of 27-0-18 applied to the plots free of phosphorous addition and 24-8-18 at an equivalent rate to the above applied to plots with phosphorous. The result for pre-plant fertilizer addition then was 78 lb N, 26 lb P, and 49 lb K applied to phosphorous addition plots and the same amount of nitrogen and potassium applied to plots without added phosphorous.
Supplemental fertilizer applications to trial plots through the beginning of September were in total the equivalent of 172 lb N, 0 lb P and 12 lb K and were achieved with applications of CN9, 0-0-25, and UN32.
Yield data for marketable and cull fruit was taken once a week beginning April 30 and ending September 2. Soil data was taken once a month starting in October, 2009 and no samples taken in June or July of 2010. Plant tissue data consisting of whole leaf blade nutrient concentrations was taken April, May, August and September.
Results- Year 1
Fruit Yield: There were no significant differences in marketable fruit yield or number in any month sampled, nor were there any significant differences in yields and numbers of cull fruit.
Blade and petiole information given below is a summary of the data sampled over the course of the first year of this study. There are no significant differences by date between plots with P added and those with no P added.
Petioles by sampling date
|
|
NO3 ppm |
PO4 ppm |
%K |
|
3/2/2009 |
|
|
|
|
P added |
2295 |
2000 |
2.45 |
|
No P added |
2310 |
2035 |
2.55 |
|
5/1/2009 |
|
|
|
|
P added |
2576 |
1830 |
2.71 |
|
No P added |
2692 |
1690 |
2.56 |
|
8/24/2009 |
|
|
|
|
P added |
1237.5 |
1657.5 |
2.01 |
|
No P added |
1137.5 |
1690.0 |
1.89 |
Blades by sampling date
|
|
%N |
%P |
%K |
|
1/13/2009 |
|
|
|
|
P added |
3.52 |
0.74 |
2.31 |
|
No P added |
3.54 |
0.64 |
2.21 |
|
3/2/2009 |
|
|
|
|
P added |
3.62 |
0.84 |
2.06 |
|
No P added |
3.67 |
0.89 |
2.10 |
|
5/1/2009 |
|
|
|
|
P added |
2.87 |
0.41 |
1.71 |
|
No P added |
2.90 |
0.39 |
1.81 |
|
8/24/2009 |
|
|
|
|
P added |
2.64 |
0.36 |
1.76 |
|
No P added |
2.63 |
0.35 |
1.69 |
Field soil phosphorous was 90 ppm as per Olsen’s P before trial placement and average readings were 85 ppm from plots with additional phosphorous added, and 87 ppm from plots where no phosphorous was added. These readings are not significantly different from one another.
Results- Year 2
Fruit yield: There were no significant differences in marketable fruit yield or number in any month sampled, nor were there any significant differences in total yield of cull fruit or number.
Blade and soil nutrient information given below is a summary of the data sampled over the course of the second year of this study. Unless indicated so, there are no significant differences between plots with P added and those with no P added by date.
Blades by sampling date
|
|
%N |
%P |
%K |
|
4/8/2010 |
|
|
|
|
P added |
2.58 |
0.56 |
1.6 |
|
No P added |
2.62 |
0.55 |
1.6 |
|
5/27/2010 |
|
|
|
|
P added |
2.72 |
0.36 |
1.56 |
|
No P added |
2.74 |
0.37 |
1.54 |
|
8/10/2010 |
|
|
|
|
P added |
2.46 |
0.34 |
1.38 |
|
No P added |
2.50 |
0.34 |
1.41 |
Soil by sampling date
|
|
NO3 ppm |
Olsen P |
K ppm |
|
4/8/2010 |
|
|
|
|
P added |
16.35 |
85 |
179.3 |
|
No P added |
16.15 |
83 |
175.8 |
|
5/27/2010 |
|
|
|
|
P added |
10.50 |
86 |
170.3 |
|
No P added |
3.51 |
76 * |
182.9 |
|
8/10/2010 |
|
|
|
|
P added |
9.73 |
84 |
106.4 |
|
No P added |
9.91 |
82 |
125.5 |
* Significantly differs (P=0.05, Student Newman Kuels)
Comments and Discussion: It is clear that the addition of phosphorous in this study covering two years of distinct strawberry crops did not result in yield differences, nor in plant tissue concentrations.
That soil P values did not decline very much, if at all, in both years should not be surprising. For one, the soil test value is a measure of the soil P equilibrium, which means that when plants remove P from the soil solution, additional P comes into the solution from precipitated forms. In other words, a soil with a high P test like the one in these tests simply backfills what is taken up by the plant from its ample reserve. Secondly, according to sampling done by Tim Hartz and his lab over the past few years, we have no indication that strawberries are removing more than 40 lb P per acre per season, meaning that soil test P would not decline more than 15 ppm even if no more P were to come into solution as described above. It simply will not fall very much.
Many thanks to Tim Hartz at UC Davis and the DANR Analytical Laboratory at Davis for their dedicated assistance with this work.
Finally, I want to thank the grower who collaborated with me on this work for two years. You know who you are, and you helped me a lot- I wouldn’t have been able to even think about doing this study if you hadn’t helped me so much. Thank you!
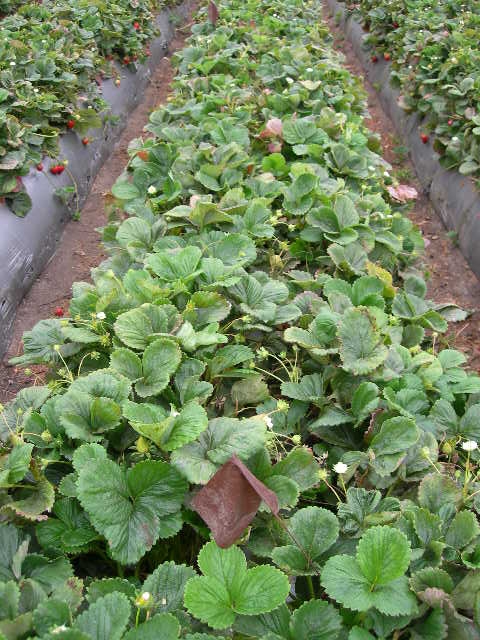
Phosphorous fertilizer added plot, mid August 2009
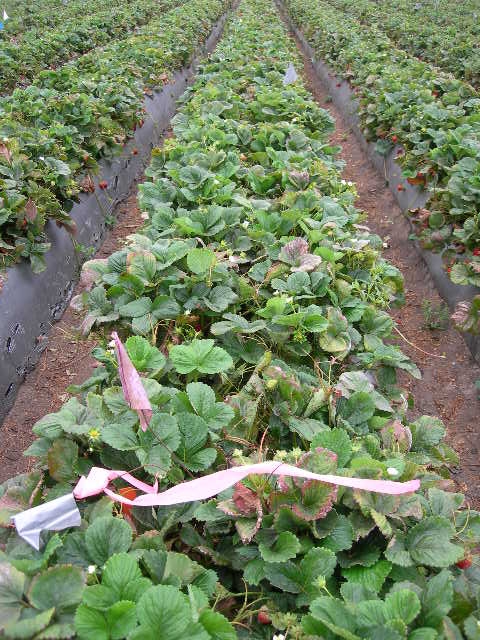
No added phosphorous fertilizer plot, mid August 2009
Fertilizer Management in Strawberry Production
by Tim Hartz and Mark Bolda
During the 2010 production season we conducted a survey of approximately 30 commercial fields in the Watsonville-Salinas area to develop information on strawberry nutrient requirements, and to evaluate current fertilizer practices. We did whole plant sampling in four fields, two planted with ‘Albion’ and two planted with a day-neutral proprietary variety. In all fields the uptake of nitrogen was slow through the winter months; by the end of March total crop N uptake was less than 20 lb/acre. From that point forward, crop N uptake was quite steady, averaging between about 1-1.2 lb N per acre per day. By the end of August, total N uptake ranged between 140-190 lb N/acre, with the higher amounts in higher yield fields. Total phosphorus (P) and potassium (K) uptake averaged about 40 and 230 lb/acre, respectively.
Soil sampling showed that the majority of fields began the season with high soil test levels of P and K, in many cases high enough that P and K fertilization would not be required to produce a good berry crop. However, it appeared that growers often follow a preplant ‘recipe’ when it comes to fertilization, and that typical ‘strawberry mix’ controlled release N/P/K fertilizers were nearly always applied, regardless of soil test nutrient levels. The efficiency of nitrogen applied preplant is also questionable. The N in common preplant controlled release fertilizers becomes available at a relatively steady rate over 6-8 months, meaning that if applied in late October more than half the N is likely to be released by the end of March. Since crop N uptake by the end of March is less than 20 lb/acre, any additional fertilizer N released by that time will be subject to leaching by rain or irrigation. A moderate amount of preplant controlled release N provides a guarantee of some N availability during the winter, but a large fall application is likely to be inefficient.
Most of the growers we worked with provided us with their fertilization records. On average, they applied a seasonal total of 187 lb N/acre, about evenly split between preplant and fertigated N. However, there were large differences among growers in their N management; seasonal rates varied from less than 150 lb N/acre to nearly 300 lb N/acre, with some growers using nearly all preplant N, while others applied nearly all N through fertigation. We found no correlation between seasonal N rate and fruit yield.
Early season 'Albion'
