
Posts Tagged: potassium
Potassium Nutrition of Plant and Soil
We haven't spent much time in this space discussing the plant nutrient potassium (K), because my experience here on the Central Coast in berries is that it rarely shows up as a deficiency. Be that as it may, when UCCE colleague Scott Stoddard (UCCE Farm Advisor in Merced County) recently gave a webinar on this very material together with Compass Minerals, I jumped on the chance to learn more about it.
Potassium in the Plant: Potassium varies in plants depending on age and physiological maturity. A good way to check whether plants are getting enough is to take leaf samples. According to the DRIS work in strawberry I did with UCCE Specialist Tim Hartz and Farm Advisor Mark Gaskell, 1.8 to 2.2% K in the leaf prior to harvest, and 1.3 to 1.8% K during harvest indicates sufficiency in the plants. Note that these levels are for whole leaves, not petioles. Leaf concentrations for caneberries are likely to be pretty close to these, but this has not been empirically investigated in California. Of all the nutrients essential to plant growth, the concentrations of K in the tissue are only surpassed by nitrogen. K is all over in the plant, and some 60% of it is found in the chloroplasts. Since plants, as with nitrogen and phosphorous, will mine their older leaves to move these macronutrients to the younger leaves, K deficiency will first show up in the older leaves. Typical symptoms are white speckling and yellowing and necrosis on leaf margins.
The fruit are also a major sink for this nutrient. For example, in strawberry some 3.7 lbs K2O per acre are removed for every ton of fruit harvested (according to the USDA, raw strawberries contain 153 mg of K per 100 g of fruit), meaning that an average crop yield of strawberries of 6000 ten lb crates is removing 110 lbs K2O per acre.
Potassium in the Soil: Availability in the soil of K to the plant is mediated by many factors including cation exchange capacity (CEC), type of clay, amount of exchangeable K, soil moisture, soil pH, temperatures and to an extent the genetics and developmental stage of the plant. Plant available K exists in the soil in three forms: soil solution K (usually 1 ppm – 10 ppm, which is not nearly enough for plants), exchangeable K (the form of K usually measured by soil tests, mostly found in concentrations of 30-300 ppm, 30 ppm being deficient and 300 ppm being high) and fixed, non-exchangeable K (around 1000 ppm). An equilibrium exists between these three forms, meaning that as the easily available soil solution K is taken up by the plant, it is readily buffered (replaced) by exchangeable K, followed by a more slow buffering and replacement by non-exchangeable K. A laboratory soil test for potassium (ammonium acetate test) measures the soil solution plus exchangeable K. However, it is important to remember that a potassium soil test is a useful but imperfect indicator of K availability to plants. There are situations when supplemental K may be needed even when the soil tests high.
Interference by other Soil Cations: The cations magnesium (Mg), calcium (Ca) and sodium (Na) all can all interfere with plant uptake of K by competing for binding sites in the soil. High alkalinity (high pH), calcareous soils can be cause of a problem with Ca, and Scott shares that soil Mg at 10 times the amount of K (converted to millimole equivalents) can be a source of interference problems as well. For example, research by UC Extensionist Specialist Dr. Tim Hartz and UCCE Farm Advisor Gene Miyao in processing tomatoes has found that if K accounts for less than 2% of the soil CEC, yield and fruit color improve from fertilizer K. In soils deficient in K, or in soils where K is sufficient but Mg is elevated, the magnesium can replace potassium on the exchange complex. Tomatoes have yellow shoulders and melons are soft.
That being said, note that most crops are very resilient to wide ranges of nutrient ratios, and in most areas south of the Sacramento Delta, magnesium has no negative impacts on strawberry production, nor is it commonly known to have negative impacts on strawberry production on the Central Coast.

Leaflet of potassium-deficient strawberry; note the darkening at the margins which can eventually lead to necrosis. Darkening may develop along the midvein, near the base of the leaflet. Photo from "Strawberry Deficiency Symptoms" Ulrich et al. UC ANR Bulletin 1917.
UCCE Potassium Webinar
Pretty interesting looking webinar on potassium as a plant nutrient coming up this March 19. I've already signed up - it's free and the presenter, UC Cooperative Extension's Scott Stoddard, knows this stuff really well. Should be time well spent:
Announcing a Meeting on January 30 on Strawberry Mineral Nutrition
This post is to announce a meeting on strawberry mineral nutrition to take place this coming January 30. I think it might be good to spend a little bit of time on the current salt situation as well, seeing as it is related to nutrition and water.
First presentation will be in Spanish, and the second in English, with translation provided for both.
Growers and PCA's - bring a copy soil and/or tissue sample analysis for review of sufficiencies/deficiencies/toxicities in our final exercise.
Look forward to seeing you there!
MG156
Will the Breakup of the Potash Cartel from the former Soviet Union Affect Berry Cost of Production?
This past July the Russian potash producer OAO Uralkali threw the global potash market for a loop by halting its long running cooperation in what was essentially a cartel with the Belorusian owned producer Belaruskali, enabling it to now produce potash flat out and very likely gain a lot of market share. Not incidentally this move has landed the CEO of Uralkali in house arrest for abuse of power and embezzlement. Whatever the case may be, this decision has turned an oligopoly for potassium supply into a much freer market, and has consequently sent potash prices plummeting, crushing the shares of several listed American potash distributors in the process (Graphic 1 and 2 below).
In numbers, Uralkali plans on increasing production of potash from 10.5 million pounds this year to 13 million next year, out of a total global market of some 50 million pounds per year. According to Bloomberg, this separation of the two companies should bring the price of potash from above $400 a ton before July, 2013 to approximately $300 a ton.
What does this mean for local berry producers? Probably not a lot. First, potassium is a tiny proportion of berry cost of production of the already small cost of fertility at under 2% of the total. Second, if my experience and lots of soil and tissue samples serve me right, there is not much necessity for adding much more potassium to many of our soils! After decades of potassium fertilizer additions, this non-mobile nutrient has built up to astonishing levels in many of our fields (adequacy of K in soil in usually thought of being 200-300 ppm and in leaf tissue above 1.3% during the harvest season), meaning in most cases that required additions are quite small.
Contrast this with the case of the Central Valley for producers of heavy potassium feeding crops such as almonds for example. Scanning the Cost of Production studies for almonds, we find that annual potassium fertilizer use resides north of 5% of total costs of production, not to mention that the “potassium gravy train is coming to an end” for many other crops of the San Joaquin Valley in the words of Dr. Tim Hartz of UC Davis, with the decades long draw down of what were formerly potassium rich soils. Might be a good time for these growers to start loading that potassium back up again while prices are down.
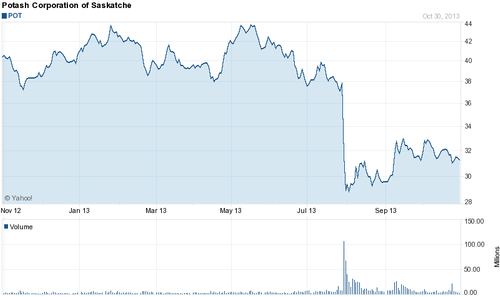
Shares of Potash Corporation pounded in late July after the break up of the Belorussian potash cartel - what does it mean for local berry producers?
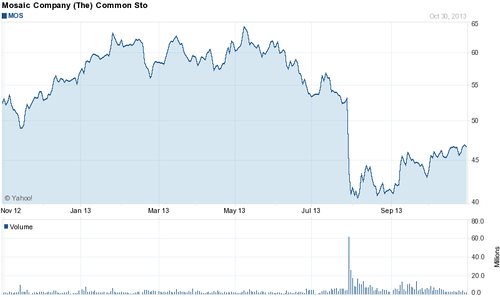
Shares of the Mosaic Company down heavily in late July after the break up of the Belorussian potash cartel - maybe a good time to bring K deficient soils back to par.
Micronutrient deficiency in raspberry
Two weeks I was called out to investigate the situation in organically farmed red raspberry that the reader can see below. The plants are pushing forth an impressive crop of fruit and overall the plant stand is strong yet numerous laterals are showing a yellowing of the leaves, especially towards the tips.
The Problem: The youngest leaves on the ends of fruiting laterals were showing a distinctive yellowing. Looking closely at affected leaves, one can see that the veins of the affected leaves remain green to some extent.
Field Evaluation: The farm manager and I initially looked around for arthropods (insects and mites) or damage as well as extirpating a few plants to examine the roots and generate samples for submission to the UCCE diagnostic laboratory in Salinas.
We then took 4 replicated samples of yellow leaves and then four replicated samples of green leaves from the same stage (between the 5th and 7th leaf from the tip) of apparently healthy laterals. We also took soil samples down to about six inches deep from four distinct areas of the field. All samples were submitted to the Soil Control Laboratory in Watsonville for analysis.
Results:
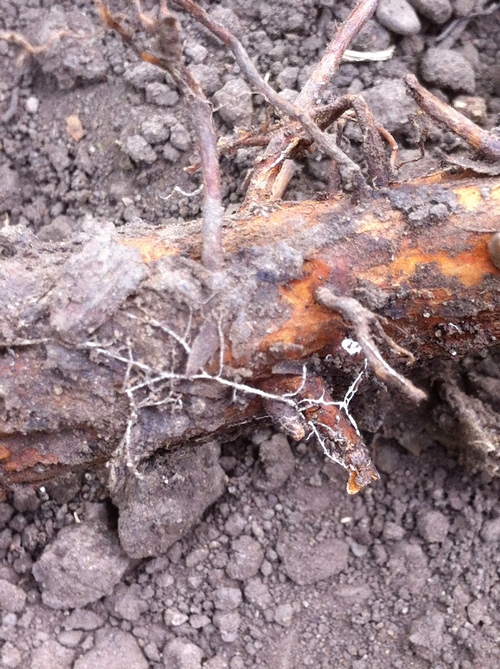
No arthropods of any consequence were found during our visit, nor did the UCCE diagnostic laboratory come up with any plant pathogens. The mycelial threads we found on the crown and roots (last photo below) of the cane are those of a saprophytic fungus and present no threat to the plant.
The means of the replicated tissue samples were compared through a Student’s t-test and the results are presented below in Table One.
Table One. Average Mineral Concentration of Green and Yellow Leaves
|
Mineral |
Green Leaves |
Yellow Leaves |
T-test p value |
|
Total Nitrogen (%) |
2.825 |
2.875 |
0.4950 |
|
Total Phosphorous (%) |
0.19 |
0.2025 |
0.2394 |
|
Potassium (%) |
1.425 |
1.925 |
0.0088 |
|
Calcium (%) |
1.675 |
1.375 |
0.0462 |
|
Magnesium (%) |
0.4525 |
0.375 |
0.0139 |
|
Sulfur (%) |
0.165 |
0.15 |
0.1817 |
|
Copper (ppm) |
4.725 |
4.625 |
0.7629 |
|
Zinc (ppm) |
14.25 |
14 |
0.3910 |
|
Iron (ppm) |
530 |
380 |
0.0270 |
|
Manganese (ppm) |
42.75 |
21.25 |
0.0016 |
|
Boron (ppm) |
73.25 |
68.5 |
0.2777 |
|
Molybdemum (ppm) |
1.625 |
1.55 |
0.7680 |
|
Sodium (ppm) |
172.5 |
167.5 |
0.1817 |
|
Chloride (ppm) |
5250 |
3125 |
0.0520 |
|
Nitrate (ppm) |
1115 |
1800 |
0.3185 |
As one can see, there are several minerals, being magnesium, manganese, calcium and iron, which are significantly lower (p<0.05) in concentration in the yellow leaves than in the green. Conversely, potassium is much higher in the yellow than in the green.
The unfortunate thing is that since we don’t have published guidelines for these sorts of raspberry varieties (for example like the recently published DRIS study in strawberry), we have to refer to out of state raspberry fertility guidelines for other varieties to get a handle on the meaning of all these numbers. Using these guidelines, we find that the concentration of manganese in the yellow leaves falls below the consensus of a lower threshold of sufficiency of about 30 ppm. In contrast, concentrations of iron, calcium, and magnesium, even though they are significantly lower in the yellow leaves than the green, are still within the generally accepted ranges of sufficiency.
We do get a glimpse also of the tolerances of these raspberry plants to chloride and sodium, which can be useful for future reference. The green leaves contain about 5000 ppm chloride and around 170 ppm sodium. These concentrations in my experience would be cause for some plant distress in strawberry, but apparently these levels are fine here.
The averages of the soil samples are below. As there was no area in the field showing more yellow than others, simply four composites of six individual samples were taken to get an understanding of the background mineral concentration of the soil.
Table Two. Average Mineral Concentrations of Soil
|
Mineral |
Soil Concentration |
|
NO3-N (ppm) |
10.83 |
|
NH3- N (ppm) |
5.70 |
|
Phosphorous (ppm) |
102.00 |
|
SP (%) |
59.33 |
|
pH |
7.63 |
|
ECe (dS/m) |
0.91 |
|
Calcium (meq/L) |
4.73 |
|
Magnesium (meq/L) |
2.37 |
|
Sodium (meq/L) |
1.63 |
|
Potassium (ppm) |
0.49 |
|
Chloride (meq/L) |
1.83 |
|
SO4-S (meq/L) |
2.40 |
|
SAR |
0.87 |
|
Boron (ppm) |
0.65 |
|
Copper (ppm) |
1.53 |
|
Zinc (ppm) |
4.77 |
|
Iron (ppm) |
27.67 |
|
Manganese (ppm) |
3.90 |
Nothing jumps out here from this table of soil concentrations. Nitrates might be a tad lean at 10 ppm, phosphorous is typically high, pH is normal, ECe is a comfortable 0.91 and the micronutrients are available in some quantity.
The question is then what is the conclusion? We have no arthropod or pathogen compromising the plants ability to take up nutrients or anything else. Lacking any other explanation, my take would be twofold. One is that the pH of 7.6 in the soil is limiting the manganese, and that the big fruit load could be also drawing off this nutrient from the leaves and moving them to the fruit. My choice of corrective action would be to add manganese, along with iron and magnesium, just to be sure, to this planting.
Thanks to Patrick Kingston and his boss for having me out on this call. It’s always great to collaborate on issues with such enthusiastic and smart up and comers in our industry.
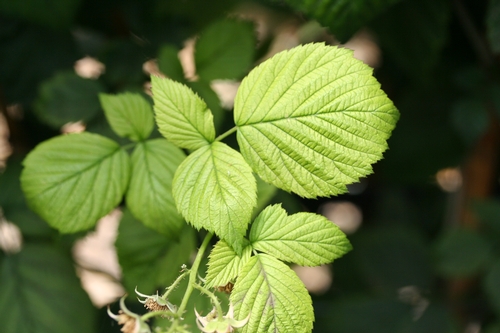
Young yellow leaves.
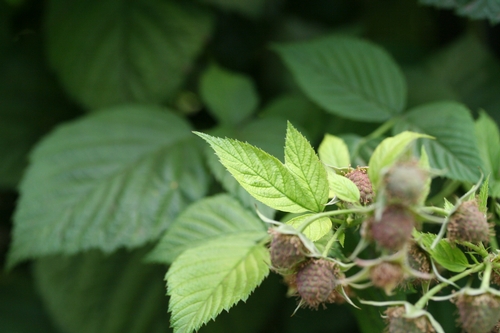
Good example of remaining green color of leaf veins.
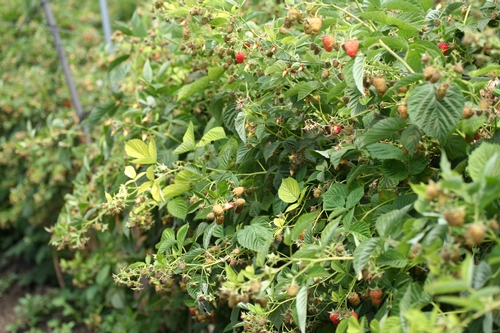
Massive fruit load, interspersed with yellow leaves at tip of lateral.
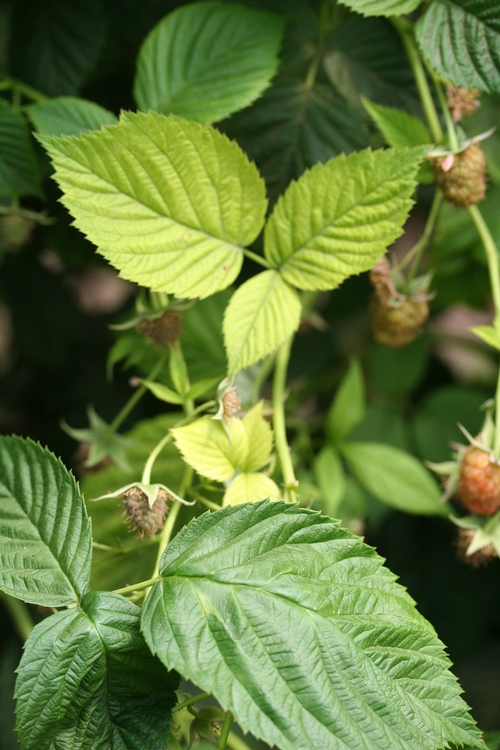
Healthy green leaf contrasted with the yellow leaves of another lateralbehind it.
Thread of mycelia on crown of raspberry cane. Not a pathogen, instead a harmless saprobe.
