
Posts Tagged: calcium
Sodium Adsorption Ratio (SAR), Briefly
I look at a lot of soil reports these days, and the sodium adsorption ratio (SAR) is one number that is very informative to me.
Simply put, SAR of a soil extract takes into account how much the adverse effect of sodium (Na+) is moderated by the other cations calcium (Ca2+) and magnesium (Mg2+). As you all know, calcium and magnesium can replace sodium on soil particles, subsequently permitting this toxin to be washed away from the plant roots. So the more free calcium and magnesium we have around in the soil, the better odds we have of mitigating sodium.
SAR levels below 6 are OK, levels which run above 10 mean trouble.
Although most soil reports will give you a calculated value for SAR, you can calculate SAR yourself. It's simple: SAR = Na+/((1/2(Ca2+ + Mg2+))1/2 ), where Na+, Ca2+ and Mg2+ are all measured in meq/L (milliequivalents per liter).
Quick Tip on Interpreting Calcium Results on Soil Analyses
Another short summary from the Fertility Short Course held by Tim Hartz and Stuart Pettigrove at UC Davis this past fall.
Calcium (Ca) has an important role in plant nutrition, but we tend not to pay too much attention to it because rarely is it an issue in berry health on the Central Coast. As outlined further on in this post, it's because we have so much of it already in our soils here.
Crop uptake of calcium is in the range of 100- 300 lb per acre, which means having a soil test like the one below with something around 5100 ppm has a potential supply of 10,200 lbs of Ca per acre (5100 PPM x 2 = 10,200 lbs/A) in the top 6” of soil apparently is well excess of what is needed.
Then again, we know that all the Ca removed in this ammonium acetate (NH4OAc) extraction is not all available to the plant because it can be tied up on soil particles, organic matter, colloids or precipitated out as Ca compounds.
A saturated paste analysis like the one on the left of the soil test below (circled in green) is the way to address what is really available to the plant. Results are most commonly given in meq/l, meaning milliequivalents per liter solution.
To get a feel for the Ca availability that we see on our saturated paste soil results, bear in mind that hydroponic solutions for greenhouse or substrate production, which are formulated for optimum crop growth and production, are 4-8 meq Ca/liter, and comprise 30-50% of the total cation meq. Comparing this ideal formulation with a survey (see link below) of representative crop production soils in coastal and central California which found of average of approximately 6.6 meq/liter Ca (assuming a 5:1 ratio soil solution/saturated paste and equivalent to 660 ppm Ca) and represented 55% of the cation milliequivalents. This amount, roughly calculated out, arrives at 600 lb Ca in soil solution. To reiterate from the above, crop removal is around 100-300 lb per acre, so this gives us a lot of confidence that we really have ample Ca around here for our berry crops.
Thinking through this to its practical application in the field, compared to the large amounts of calcium already available in our soils, fertilizer additions of calcium don't really add that much at all. For example, the “calcium kick” from a fertilizer like CAN-17 (12.3 lb/gal, 8.8 % Ca, so a 3 gal/A application simply adds 3.25 lbs of Ca/A - a mere drop in the pool of 600 lbs already there for the plant) isn't much of a kick at all.
Here is the excellent link discussing calcium availability in coastal and central California soils referred to in this post :
http://www.cdfa.ca.gov/is/docs/04-0701Hartz%2007.pdf
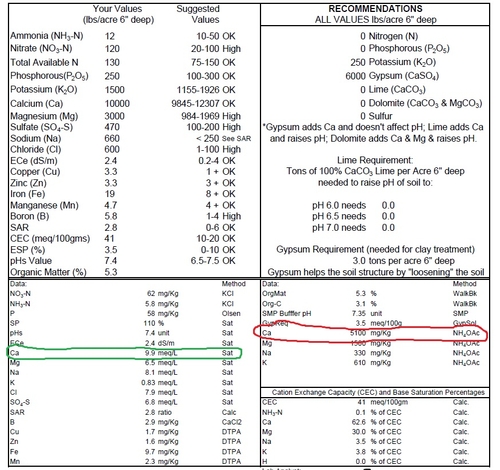
Soil sample from strawberry field taken last year. Potential calcium supply is 5100 ppm on the right and circled in red, and saturated paste, a measure of calcium availability, is 9.9 meq/l, is on the left circled in green.
Interesting Case of Salt in Coachella Valley
You may have noticed I've changed the title of this post. I talked with Michael Cahn from UCCE Monterey and yes, that is salt on the surface of this soil, and its pretty impressive and all, but this stuff is pretty likely calcium carbonate or calcium sulfate which precipitate out pretty easily and present less harm to the plant than something like sodium or chloride.
So it's still a salt, but not one which is super harmful to the plants. Lots of you are seeing this white stuff on the bed tops and furrows right now, again it's most likely calcium carbonate or calcium sulfate. More to come on this subject later.
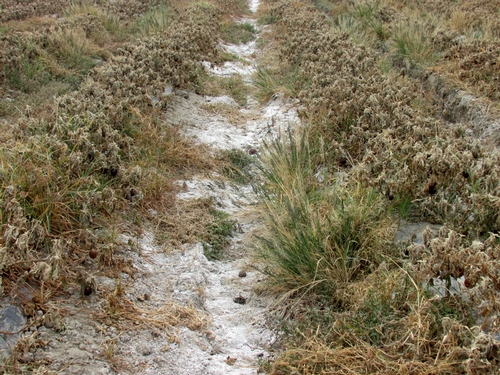
Eggplant planting in the Coachella Valley. White material in the furrow is very likely calcium carbonate or calcium sulfate, which are salts.
Base Cation Saturation Concept: Does the Ca:Mg Ratio Affect Crop Yields?
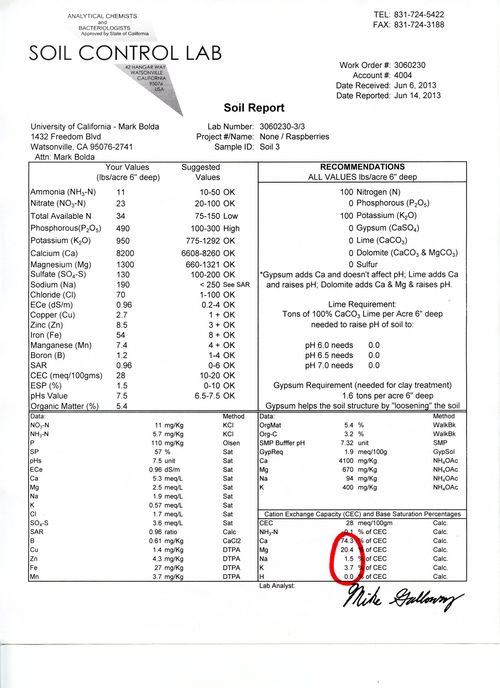
There are two ways to interpret soil testing of the cations calcium (Ca) and magnesium (Mg), from the field: one by basic cation exchange ratios and the other by sufficiency. Base cation saturation ratios appear in most soil reports (see area circled in red below) and consist of percentages of calcium, magnesium and also potassium, sodium and hydrogen. Tim Hartz from UC Davis addressed this topic head on at the recent UC Soil Fertility Short Course held on October 23.
Proponents for examining cation ratios, for example Albrecht and Stiener, have held that there is an ideal cation ratio, meaning that the optimum soil environment for crop plants occurs when the cation exchange complex is 65% Ca : 10% Mg : 5% K : 20% H. To some extent this makes sense, since it has been shown that the base saturation of an individual cation can affect its availability to plants and that the uptake of one cation may affect the uptake of others.
However, research testing a variety of ratios of cations in the soil, especially Ca and Mg, has not found much in the way of identifying a true ideal ratio. As an example given at the short course in Davis, a study in Wisconsin that doubled and even quadrupled the exchangeable Ca: Mg ratio resulted in no difference in yield of alfalfa hay per acre.
It was rather suggested that growers and managers should concentrate on making sure each nutrient is in sufficiency for plant uptake rather than on reaching some favorable cation saturation ratio.
Most California soils have an abundance of calcium and magnesium in them already. In the soil test shown below, which is from a representative raspberry soil of the Pajaro Valley, we have 4100 ppm (mg/Kg) of calcium and 670 ppm magnesium, which when we multiply times two equals 8200 lbs of calcium and 1340 lbs of magnesium in the top 6” of soil, compared to the approximately 100 lbs of calcium and 25 lbs or so of magnesium that we need for a decent berry crop. We have A LOT of calcium and magnesium in our soils.
Moreover, it’s pretty expensive to try and alter the calcium and magnesium ratios of a soil. For example, more than 1700 lbs of gypsum will be needed to be added per acre to raise the calcium by 20 ppm. So, outside of extreme misbalances of calcium and magnesium which result in structural problems like crusting, it’s probably not worth the effort and money to obtain a ratio which doesn’t seem to offer anything extra in the way of nutrient sufficiency.
In conclusion, the truth of the matter is really that even though cations do compete with another for plant uptake and have different effects on soil structure, it is nevertheless completely possible to have high plant productivity with a wide range of ratios of calcium to magnesium.
The link below is an article with a full discussion of the concept of soil cation ratios.
http://www.soils.wisc.edu/extension/wcmc/2004proceedings/Kelling1.pdf
mpbolda145
Micronutrient deficiency in raspberry
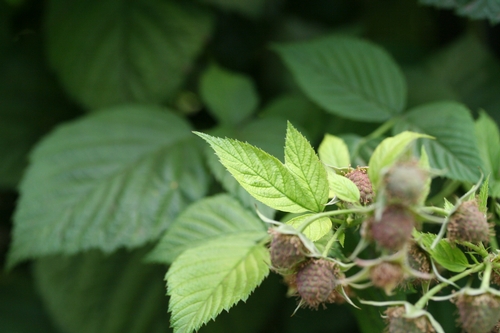
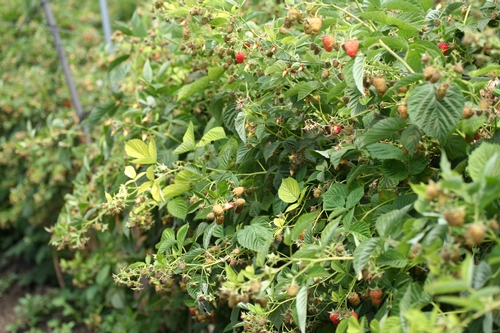
Two weeks I was called out to investigate the situation in organically farmed red raspberry that the reader can see below. The plants are pushing forth an impressive crop of fruit and overall the plant stand is strong yet numerous laterals are showing a yellowing of the leaves, especially towards the tips.
The Problem: The youngest leaves on the ends of fruiting laterals were showing a distinctive yellowing. Looking closely at affected leaves, one can see that the veins of the affected leaves remain green to some extent.
Field Evaluation: The farm manager and I initially looked around for arthropods (insects and mites) or damage as well as extirpating a few plants to examine the roots and generate samples for submission to the UCCE diagnostic laboratory in Salinas.
We then took 4 replicated samples of yellow leaves and then four replicated samples of green leaves from the same stage (between the 5th and 7th leaf from the tip) of apparently healthy laterals. We also took soil samples down to about six inches deep from four distinct areas of the field. All samples were submitted to the Soil Control Laboratory in Watsonville for analysis.
Results:
No arthropods of any consequence were found during our visit, nor did the UCCE diagnostic laboratory come up with any plant pathogens. The mycelial threads we found on the crown and roots (last photo below) of the cane are those of a saprophytic fungus and present no threat to the plant.
The means of the replicated tissue samples were compared through a Student’s t-test and the results are presented below in Table One.
Table One. Average Mineral Concentration of Green and Yellow Leaves
|
Mineral |
Green Leaves |
Yellow Leaves |
T-test p value |
|
Total Nitrogen (%) |
2.825 |
2.875 |
0.4950 |
|
Total Phosphorous (%) |
0.19 |
0.2025 |
0.2394 |
|
Potassium (%) |
1.425 |
1.925 |
0.0088 |
|
Calcium (%) |
1.675 |
1.375 |
0.0462 |
|
Magnesium (%) |
0.4525 |
0.375 |
0.0139 |
|
Sulfur (%) |
0.165 |
0.15 |
0.1817 |
|
Copper (ppm) |
4.725 |
4.625 |
0.7629 |
|
Zinc (ppm) |
14.25 |
14 |
0.3910 |
|
Iron (ppm) |
530 |
380 |
0.0270 |
|
Manganese (ppm) |
42.75 |
21.25 |
0.0016 |
|
Boron (ppm) |
73.25 |
68.5 |
0.2777 |
|
Molybdemum (ppm) |
1.625 |
1.55 |
0.7680 |
|
Sodium (ppm) |
172.5 |
167.5 |
0.1817 |
|
Chloride (ppm) |
5250 |
3125 |
0.0520 |
|
Nitrate (ppm) |
1115 |
1800 |
0.3185 |
As one can see, there are several minerals, being magnesium, manganese, calcium and iron, which are significantly lower (p<0.05) in concentration in the yellow leaves than in the green. Conversely, potassium is much higher in the yellow than in the green.
The unfortunate thing is that since we don’t have published guidelines for these sorts of raspberry varieties (for example like the recently published DRIS study in strawberry), we have to refer to out of state raspberry fertility guidelines for other varieties to get a handle on the meaning of all these numbers. Using these guidelines, we find that the concentration of manganese in the yellow leaves falls below the consensus of a lower threshold of sufficiency of about 30 ppm. In contrast, concentrations of iron, calcium, and magnesium, even though they are significantly lower in the yellow leaves than the green, are still within the generally accepted ranges of sufficiency.
We do get a glimpse also of the tolerances of these raspberry plants to chloride and sodium, which can be useful for future reference. The green leaves contain about 5000 ppm chloride and around 170 ppm sodium. These concentrations in my experience would be cause for some plant distress in strawberry, but apparently these levels are fine here.
The averages of the soil samples are below. As there was no area in the field showing more yellow than others, simply four composites of six individual samples were taken to get an understanding of the background mineral concentration of the soil.
Table Two. Average Mineral Concentrations of Soil
|
Mineral |
Soil Concentration |
|
NO3-N (ppm) |
10.83 |
|
NH3- N (ppm) |
5.70 |
|
Phosphorous (ppm) |
102.00 |
|
SP (%) |
59.33 |
|
pH |
7.63 |
|
ECe (dS/m) |
0.91 |
|
Calcium (meq/L) |
4.73 |
|
Magnesium (meq/L) |
2.37 |
|
Sodium (meq/L) |
1.63 |
|
Potassium (ppm) |
0.49 |
|
Chloride (meq/L) |
1.83 |
|
SO4-S (meq/L) |
2.40 |
|
SAR |
0.87 |
|
Boron (ppm) |
0.65 |
|
Copper (ppm) |
1.53 |
|
Zinc (ppm) |
4.77 |
|
Iron (ppm) |
27.67 |
|
Manganese (ppm) |
3.90 |
Nothing jumps out here from this table of soil concentrations. Nitrates might be a tad lean at 10 ppm, phosphorous is typically high, pH is normal, ECe is a comfortable 0.91 and the micronutrients are available in some quantity.
The question is then what is the conclusion? We have no arthropod or pathogen compromising the plants ability to take up nutrients or anything else. Lacking any other explanation, my take would be twofold. One is that the pH of 7.6 in the soil is limiting the manganese, and that the big fruit load could be also drawing off this nutrient from the leaves and moving them to the fruit. My choice of corrective action would be to add manganese, along with iron and magnesium, just to be sure, to this planting.
Thanks to Patrick Kingston and his boss for having me out on this call. It’s always great to collaborate on issues with such enthusiastic and smart up and comers in our industry.
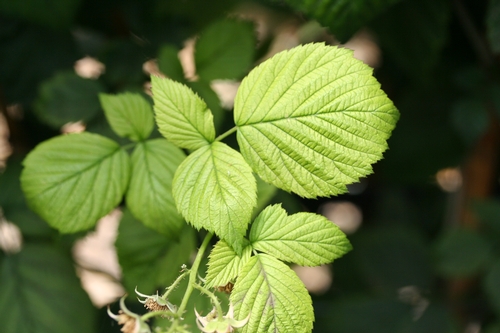
Young yellow leaves.
Good example of remaining green color of leaf veins.
Massive fruit load, interspersed with yellow leaves at tip of lateral.
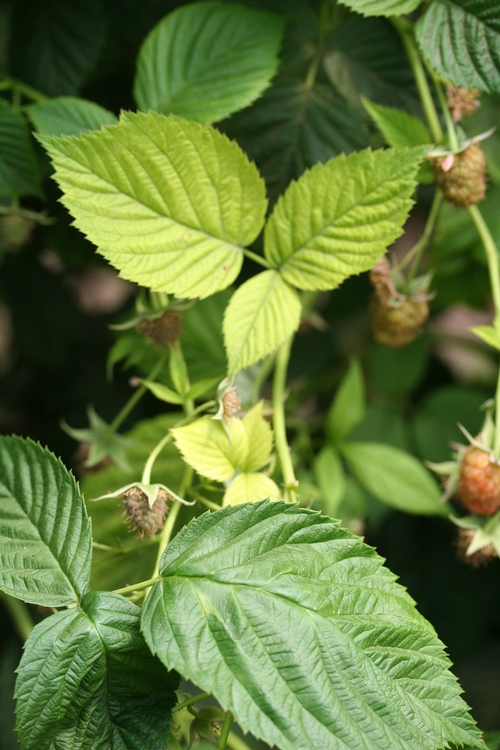
Healthy green leaf contrasted with the yellow leaves of another lateralbehind it.
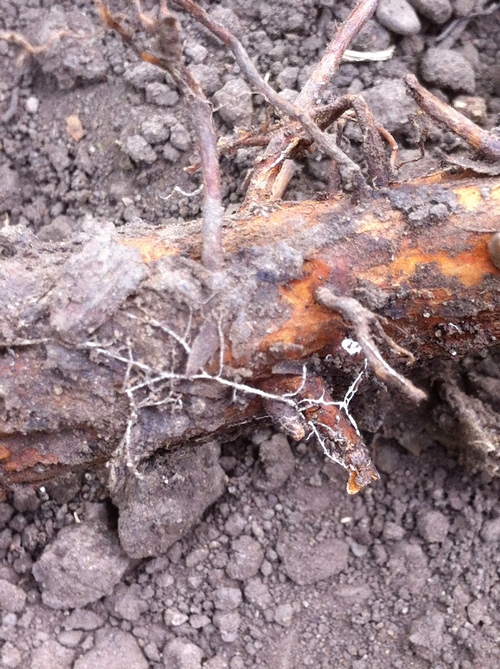
Thread of mycelia on crown of raspberry cane. Not a pathogen, instead a harmless saprobe.
