
Posts Tagged: salt
Announcing the Third International Salinity Forum
I'm thinking this could be a really good meeting for some of us to go to. Lots of smart people from some really dry places talking about salt in the water and the soil and then how to manage it. Plus the meeting is in California.
http://salinityforum2014.ucr.edu/Preliminary%20Program%20121813.pdf
X
Further Understanding Salinity in Berries
Just had a great conversation with Mike Cahn, our Irrigation and Water Resources Advisor in Monterey County regarding the salt issues in the berry fields on the Central Coast.
The Basics of Salinity Measurement: Electrical conductivity (EC) is a measure of the combined effect of all the salts in the soil or irrigation water. Generally in irrigation water an EC of less than 1.5 dS/m is not known to present problems for growing strawberries. Strawberries can often tolerate water of EC above 1.5 if the main salts are calcium and sulfate. Soil EC thresholds for strawberry were based on a saturated paste extract from the soil. A soil paste extract with an EC of 2 or 3 shouldn’t be seen as a big issue for strawberries. Directly measuring soil EC with a probe (see the example in the photo below) will often produce much higher numbers than would be found from a saturated pasted extract because the salts are concentrated in less soil moisture.
There are different types of salt, and some are more harmful than others to the roots of the plant. One way of gauging how great the potential of harm a certain species of salt presents to the plant is how easily it precipitates out of solution – salts which stay in solution easily will tend to get taken up by the plant root when it pulls up the water while those which precipitate out are solid and not capable of being taken up by the plant root.
So, take for example calcium carbonate and calcium sulfate, which are both salts and matter of fact compose most of that white stuff we are seeing on the surface of the soil around here. This white stuff is a precipitate and as a solid won’t be taken up and no longer presents a danger to the plant root. Sodium and chloride on the other hand, stay in solution much more easily and therefore can also be taken up by the plant root. Moreover, since sodium and chloride continue to stay in solution even as water is evaporating away, their concentration rises and they become even more harmful to the plant roots and the plant itself.
Managing Sodium and Chloride: Fortunately, it’s pretty easy to leach away sodium and chloride from around the plant roots. One just needs to add more water to the soil than what is necessary for the plant. Since for example strawberry plants planted in autumn of 2013 are still quite small and the weather has been very cool (meaning low evapotranspiration), Mike estimates probably about a half to 1 inch is all they needed in the last month of December. Any water applied in excess of this amount will leaching away and carrying whatever salt is in solution .
Possible Salt Accumulation from Fertilizers: Since it would seem that harmful levels of sodium and chloride are being leached away by current irrigation practices, Michael and I focused our conversation on the possibility of nitrates from fertilizer – especially the pre-plants- being a major source of the salt damage that we are currently experiencing in our area. Because preplant N is applied in bands near the roots of the transplants and there is little uptake of N at this early stage of growth, nitrate released from the fertilizer may be increasing the salinity near the roots. We calculated that if 90 lbs of N/acre released from 2 bands of fertilizer on 52 inch wide beds, the salinity may increase in the root zone by 3.4 dS/m. During a typical year about 12 inches of rainfall will occur between December and March. During a drought year, it is possible that the irrigation water applied is of sufficient volume to activate the pre-plant fertilizer but not enough to wash it away and so there is a consequent buildup of harmful nitrate (a salt) right around the root ball.
This will be worth looking into in the very near future.
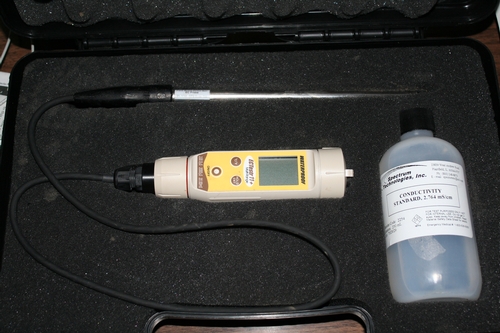
EC meter ready to go. See the post above for how to correctly interpret the results of these meters.
Interesting Case of Salt in Coachella Valley
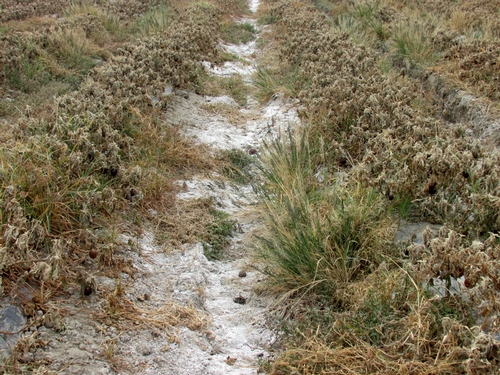
You may have noticed I've changed the title of this post. I talked with Michael Cahn from UCCE Monterey and yes, that is salt on the surface of this soil, and its pretty impressive and all, but this stuff is pretty likely calcium carbonate or calcium sulfate which precipitate out pretty easily and present less harm to the plant than something like sodium or chloride.
So it's still a salt, but not one which is super harmful to the plants. Lots of you are seeing this white stuff on the bed tops and furrows right now, again it's most likely calcium carbonate or calcium sulfate. More to come on this subject later.
Eggplant planting in the Coachella Valley. White material in the furrow is very likely calcium carbonate or calcium sulfate, which are salts.
A Tsunami of Salt is on the Way
Just completed a full diagnosis with UCCE colleagues Jose Aguiar and Steve Koike of some stunted strawberry plants depicted below from the Coachella Valley. Steve's diagnostic lab found nothing, so we moved on to an analysis of the soil and tissue.
Same deal as what we have been starting to see up here; stunted plants, burnt leaf margins and dying plants. I ran the samples through a lab test, and sure enough the soil EC for the dead plants is 3.5 dS/m, for dying plants 3.0 dS/m and soil from healthy plants 1.6 dS/m. Seems the issue is one of a lack of volume and/or movement of water in the sick plots, because we see the easily leachable nitrates and sodium higher in the samples from the dead and dying plants (nitrates: 26 and 30 ppm; sodium: 345 and 299 ppm - yikes!) than from the soil around the healthy plants (nitrates: 9.7 ppm; sodium: 147 ppm).
1/2/2013 Update from tissue samples: Healthy plants (N 2.9%, P 0.52%, K 2.0 %, Mg 0.55%, Na 270 ppm, Cl 4100 ppm, Total S 0.29%, Fe 750 ppm , B 55 ppm); Dying plants (N 3.0%, P 0.47%, K 1.5 %, Mg 0.76%, Na 4500 ppm, Cl 11,000 ppm, Total S 0.4%, Fe 920 ppm , B 52 ppm). Chloride in the salty plants is up there, but does not compare to the 16x concentrations of sodium found there.
Strawberry growers across the state need to keep running that water until we get some rain. There is so much salt building up in these soils right now.
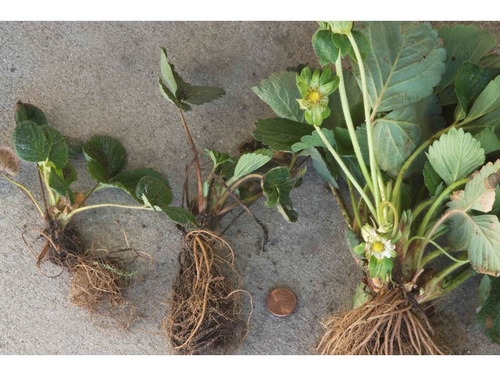
Salt affected plants from the Coachella Valley. Stunted plants on left with dying leaves, larger healthy plant on right is showing less damage. Photo Steven Koike, UCCE.
Testing a Field of Yellow Strawberry Plants in Salinas for Sodium Toxicity
The following is a test of the thesis proposed last year concerning the emergence of yellowed strawberry plants in many fields around Salinas and Castroville. To review, in the field tested last year, areas of yellow plants were found to be associated with high levels of calcium carbonate (lime), meaning that calcium tied up with carbonates was not available to limit the amount of exchangeable sodium, subsequently leaving this sodium to poison the strawberry plants and turn them yellow.
The test was done in a field in the Salinas area demonstrating classic symptoms. This particular field has several very large areas of yellowed plants, interspersed with areas of green plants which are apparently doing quite well.
I took four bulk tissue samples from each area of green plants and then another four bulk tissue samples from each area of yellow plants. Since we found last year that the very top of the bed is the area which shows the most dramatic differences in sodium concentration, a total of three bulk soil samples were taken from these levels in corresponding areas of green and yellow plants.
Refer to the tables below for the results of the tissue and soil tests.
Table One. Tissue Mineral Concentrations
|
Mineral |
Yellow Plants |
Green Plants |
|
Total Nitrogen (%) |
2.40 |
2.09* |
|
Total Phosphorous (%) |
0.74 |
0.65 |
|
Total Potassium (%) |
0.98 |
0.75 |
|
Total Sulfur (ppm) |
0.18 |
0.14 |
|
Total Boron (ppm) |
96.09 |
74.36 |
|
Total Calcium (%) |
1.00 |
1.31 |
|
Total Magnesium (%) |
0.39 |
0.42 |
|
Total Zinc (ppm) |
22.20 |
19.08 |
|
Total Manganese (ppm) |
141.82 |
169.60 |
|
Total Iron (ppm) |
230.31 |
256.02 |
|
Total Copper (ppm) |
7.78 |
6.54 |
|
Total Molybdenum (ppm) |
1.31 |
0.99 |
|
Total Sodium |
595.40 |
148.43* |
|
Total Chloride |
2683.92* |
3737.57 |
* Probability that the two sets are the same is less than or equal to 5% (p <0.05) using a Student's paired t-Test of two-tailed distribution.
Table Two. Soil Mineral and Chemical Characteristics
|
Mineral |
Yellow Plants |
Green Plants |
|
Nitrate (NO3-N) - ppm |
17.3 |
8.9 |
|
Ammonia (NH3-N) - ppm |
3.4* |
6.0 |
|
Phosphorous - ppm |
41.9 |
44.6 |
|
Potassium – ppm |
216.9 |
234.1 |
|
Calcium – ppm |
4989.6 |
3935.0 |
|
Magnesium – ppm |
1503.0 |
1138.5 |
|
Sodium – ppm |
386.2 |
335.6 |
|
Chloride – ppm |
15.2 |
17.3 |
|
SAR |
2.8 |
2.6 |
|
Zinc -ppm |
1.4 |
1.6 |
|
Iron - ppm |
9.6 |
10.5 |
|
Manganese - ppm |
3.4 |
2.4 |
|
Boron |
1.1 |
1.1 |
|
Soil pH |
7.8 |
7.6* |
|
Percent carbonates as CaCO3 |
1.41 |
0.92* |
* Probability that the two sets are the same is less than or equal to 5% (p <0.05) using a Student's paired t-Test of two-tailed distribution.
It is very easy to ascertain that this field situation is very similar to the field in Castroville evaluated last year. Sodium in the tissues of the yellowed plants is extremely high with an average of 595 ppm, compared against an average of 148 ppm in the green. Chloride curiously is lower in the yellow than in the green, but both averages are not exceedingly high.
Looking at the soil, we again find that the percent carbonates as calcium carbonate are significantly lower around the green plants than the yellow and the pH is also consequently lower around these green plants.
This indicates that calcium is being tied up around the yellow plants and not limiting the amount of exchangeable sodium. These high levels of sodium are being in turn absorbed by the plants causing them to turn yellow and in some cases even die.
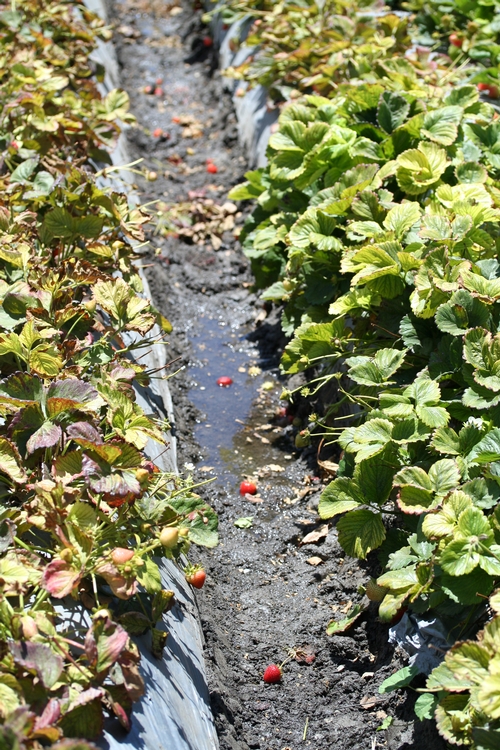
A bed of yellow strawberries next to one more or less green.
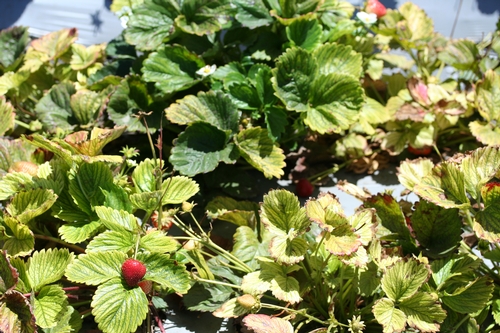
Green strawberry plant surrounded by yellow plants.
