
Posts Tagged: iron
Micronutrient deficiency in raspberry
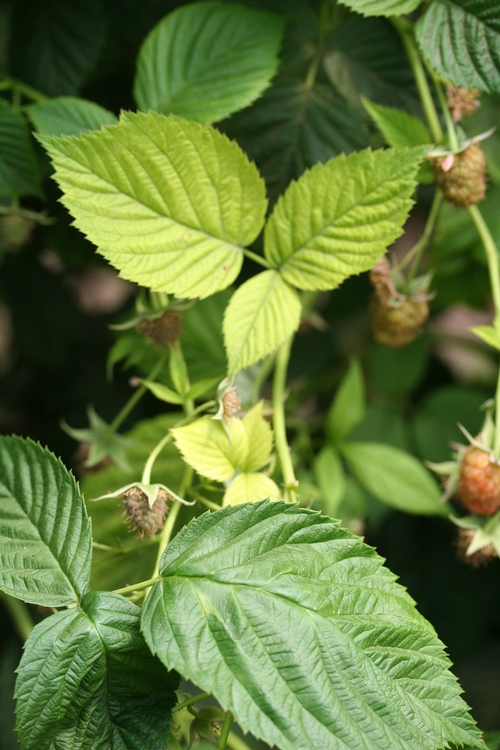
Two weeks I was called out to investigate the situation in organically farmed red raspberry that the reader can see below. The plants are pushing forth an impressive crop of fruit and overall the plant stand is strong yet numerous laterals are showing a yellowing of the leaves, especially towards the tips.
The Problem: The youngest leaves on the ends of fruiting laterals were showing a distinctive yellowing. Looking closely at affected leaves, one can see that the veins of the affected leaves remain green to some extent.
Field Evaluation: The farm manager and I initially looked around for arthropods (insects and mites) or damage as well as extirpating a few plants to examine the roots and generate samples for submission to the UCCE diagnostic laboratory in Salinas.
We then took 4 replicated samples of yellow leaves and then four replicated samples of green leaves from the same stage (between the 5th and 7th leaf from the tip) of apparently healthy laterals. We also took soil samples down to about six inches deep from four distinct areas of the field. All samples were submitted to the Soil Control Laboratory in Watsonville for analysis.
Results:
No arthropods of any consequence were found during our visit, nor did the UCCE diagnostic laboratory come up with any plant pathogens. The mycelial threads we found on the crown and roots (last photo below) of the cane are those of a saprophytic fungus and present no threat to the plant.
The means of the replicated tissue samples were compared through a Student’s t-test and the results are presented below in Table One.
Table One. Average Mineral Concentration of Green and Yellow Leaves
|
Mineral |
Green Leaves |
Yellow Leaves |
T-test p value |
|
Total Nitrogen (%) |
2.825 |
2.875 |
0.4950 |
|
Total Phosphorous (%) |
0.19 |
0.2025 |
0.2394 |
|
Potassium (%) |
1.425 |
1.925 |
0.0088 |
|
Calcium (%) |
1.675 |
1.375 |
0.0462 |
|
Magnesium (%) |
0.4525 |
0.375 |
0.0139 |
|
Sulfur (%) |
0.165 |
0.15 |
0.1817 |
|
Copper (ppm) |
4.725 |
4.625 |
0.7629 |
|
Zinc (ppm) |
14.25 |
14 |
0.3910 |
|
Iron (ppm) |
530 |
380 |
0.0270 |
|
Manganese (ppm) |
42.75 |
21.25 |
0.0016 |
|
Boron (ppm) |
73.25 |
68.5 |
0.2777 |
|
Molybdemum (ppm) |
1.625 |
1.55 |
0.7680 |
|
Sodium (ppm) |
172.5 |
167.5 |
0.1817 |
|
Chloride (ppm) |
5250 |
3125 |
0.0520 |
|
Nitrate (ppm) |
1115 |
1800 |
0.3185 |
As one can see, there are several minerals, being magnesium, manganese, calcium and iron, which are significantly lower (p<0.05) in concentration in the yellow leaves than in the green. Conversely, potassium is much higher in the yellow than in the green.
The unfortunate thing is that since we don’t have published guidelines for these sorts of raspberry varieties (for example like the recently published DRIS study in strawberry), we have to refer to out of state raspberry fertility guidelines for other varieties to get a handle on the meaning of all these numbers. Using these guidelines, we find that the concentration of manganese in the yellow leaves falls below the consensus of a lower threshold of sufficiency of about 30 ppm. In contrast, concentrations of iron, calcium, and magnesium, even though they are significantly lower in the yellow leaves than the green, are still within the generally accepted ranges of sufficiency.
We do get a glimpse also of the tolerances of these raspberry plants to chloride and sodium, which can be useful for future reference. The green leaves contain about 5000 ppm chloride and around 170 ppm sodium. These concentrations in my experience would be cause for some plant distress in strawberry, but apparently these levels are fine here.
The averages of the soil samples are below. As there was no area in the field showing more yellow than others, simply four composites of six individual samples were taken to get an understanding of the background mineral concentration of the soil.
Table Two. Average Mineral Concentrations of Soil
|
Mineral |
Soil Concentration |
|
NO3-N (ppm) |
10.83 |
|
NH3- N (ppm) |
5.70 |
|
Phosphorous (ppm) |
102.00 |
|
SP (%) |
59.33 |
|
pH |
7.63 |
|
ECe (dS/m) |
0.91 |
|
Calcium (meq/L) |
4.73 |
|
Magnesium (meq/L) |
2.37 |
|
Sodium (meq/L) |
1.63 |
|
Potassium (ppm) |
0.49 |
|
Chloride (meq/L) |
1.83 |
|
SO4-S (meq/L) |
2.40 |
|
SAR |
0.87 |
|
Boron (ppm) |
0.65 |
|
Copper (ppm) |
1.53 |
|
Zinc (ppm) |
4.77 |
|
Iron (ppm) |
27.67 |
|
Manganese (ppm) |
3.90 |
Nothing jumps out here from this table of soil concentrations. Nitrates might be a tad lean at 10 ppm, phosphorous is typically high, pH is normal, ECe is a comfortable 0.91 and the micronutrients are available in some quantity.
The question is then what is the conclusion? We have no arthropod or pathogen compromising the plants ability to take up nutrients or anything else. Lacking any other explanation, my take would be twofold. One is that the pH of 7.6 in the soil is limiting the manganese, and that the big fruit load could be also drawing off this nutrient from the leaves and moving them to the fruit. My choice of corrective action would be to add manganese, along with iron and magnesium, just to be sure, to this planting.
Thanks to Patrick Kingston and his boss for having me out on this call. It’s always great to collaborate on issues with such enthusiastic and smart up and comers in our industry.
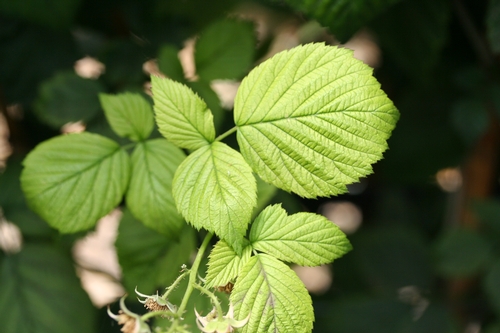
Young yellow leaves.
Good example of remaining green color of leaf veins.
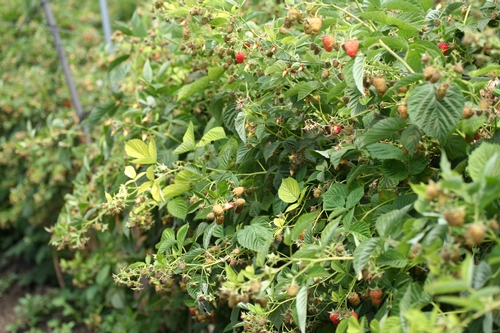
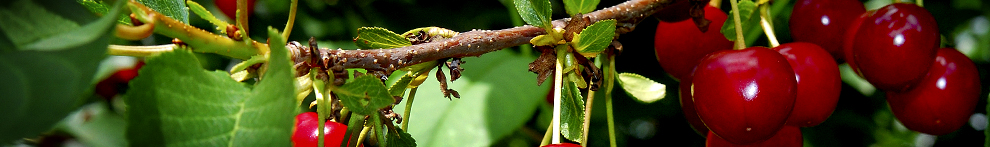
Massive fruit load, interspersed with yellow leaves at tip of lateral.
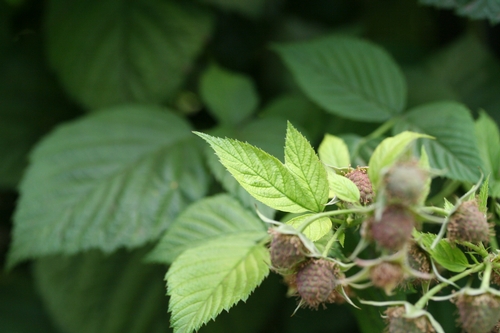
Healthy green leaf contrasted with the yellow leaves of another lateralbehind it.
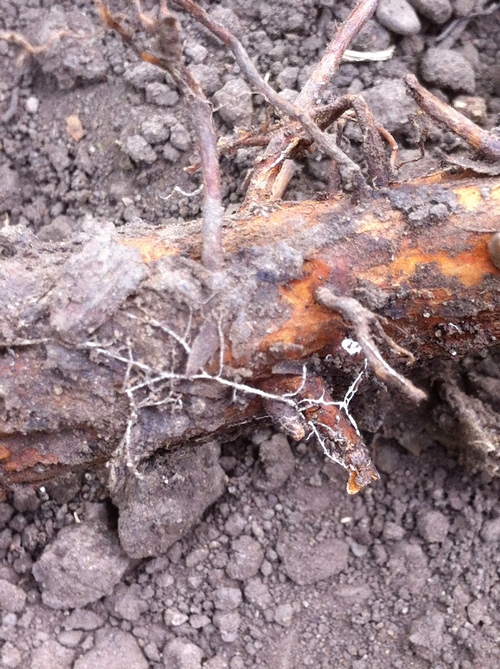
Thread of mycelia on crown of raspberry cane. Not a pathogen, instead a harmless saprobe.
Strawberry Plant Nutrient Sufficiency Levels Revised
It has been more than 30 years since UC published strawberry leaf nutrient diagnostic guidelines (Publication 4098, ‘Strawberry deficiency symptoms: a visual and plant analysis guide to fertilization’, released in 1980). In the years since that publication, varieties, production practices and yield expectations have changed considerably. In 2010 we began a project, funded by the California Strawberry Commission, to reevaluate leaf and petiole nutrient sufficiency ranges for day-neutral strawberries. With the cooperation of many berry growers in the Watsonville-Salinas and Santa Maria areas we collected leaf and petiole samples from more than 50 ‘Albion’ fields over the past two production seasons. In each field samples were collected 5 times over the production season, from early spring through September, to document the nutrient concentration trends from pre-fruiting to post-peak production. Leaf samples were analyzed for total concentration of nitrogen (N), phosphorus (P), potassium (K), calcium (Ca), magnesium (Mg), sulfur (S), zinc (Zn), manganese (Mn), iron (Fe) and copper (Cu). Petioles were analyzed for NO3-N, PO4-P and K concentration.
After the season cooperating growers provided yield information, which allowed us to categorize the fields as being ‘high yield’ or 'low yield’. We then applied a process called DRIS (Diagnosis and Recommendation Integrated System) to mathematically evaluate the difference in nutrient concentrations as well as nutrient ratios between high yield and low yield fields. This process allowed us to identify which of the high yield fields were ideally balanced nutritionally. From this group of nutritionally balanced, high yield fields we were able to calculate a DRIS sufficiency range for each nutrient at each growth stage.
Fig. 1 shows that leaf N, P and K concentrations were highest before harvest began (stage 1, which was late February in Santa Maria and late March in Watsonville-Salinas), and declined to a reasonably stable level throughout the main harvest period (stages 3-5, May-July in Santa Maria, June-August in Watsonville-Salinas). The decline in leaf macronutrient concentrations during the peak harvest period was expected; it happens in many fruiting crops because the leaves rapidly translocate nutrients to the developing fruit. By contrast, micronutrient concentrations either increased from early vegetative growth to the main harvest period (as was the case for B, Ca and Fe), or remained reasonably stable over the entire season (all other micronutrients). The vertical bars on each data point on Fig. 1 indicate the range of values typical of nutritionally balanced, high yield fields at each growth stage. These are the DRIS sufficiency ranges; leaf nutrient concentrations within these ranges can safely be assumed to be adequate for high yield production.
Table 1 lists the DRIS leaf nutrient sufficiency ranges for pre-harvest and main harvest growth stages. For the sake of comparison, both the sufficiency ranges given in UC Publication 4098 and the current University of Florida guidelines have been included. Although for most nutrients the ranges match pretty well, for others there are substantial differences. Where the DRIS sufficiency range is substantially higher than the other sources (Ca, Mn and Fe, for example) it is because those nutrients are in such abundant supply in our coastal soils that plant uptake is far in excess of actual plant requirement; for those nutrients a lab test result marginally below the DRIS range would not be a matter of concern.
For several nutrients (N, Zn and Cu) the DRIS sufficiency range fell below the other recommendations. We are confident that the DRIS ranges represent nutrient sufficiency because they were determined by measuring the levels common in high yield fields. The field survey approach used in this project ensured that a wide range of field conditions and grower practices were included, so the results are broadly representative of the coastal industry. Also, for all three nutrients the average leaf concentrations of the high yield and low yield groups were essentially equal, suggesting that availability of these nutrients did not limit yields.
Fig. 2 shows the trends in petiole nutrient concentrations over the season. Petiole NO3-N was so highly variable as to be nearly worthless as a diagnostic technique; during peak fruit harvest (our sampling dates 3 and 4) petiole NO3-N in high yield fields varied from < 200 PPM to 2,600 PPM. While we believe that leaf total N is a more reliable measurement, this study suggests that maintaining petiole NO3-N > 1,000 PPM pre-harvest, and > 400 PPM during peak harvest, is adequate to maintain high productivity. Given the high variability of petiole NO3-N it is possible that concentrations < 400 PPM would be adequate during the summer.
Petiole PO4-P and K were less variable than petiole NO3-N. Maintaining PO4-P > 1,200 PPM throughout the season should ensure P sufficiency. Given the high soil P availability in most coastal soils rotated with vegetable crops, this level is probably much higher than the ‘critical value’. Maintaining petiole K > 2.5% preharvest, and > 1.5% during peak harvest, appears to be adequate.
Table 1. Comparison of DRIS leaf nutrient sufficiency ranges with prior UC recommendations, and current University of Florida guidelines.
|
|
|
Nutrient sufficiency ranges |
||
|
Growth stage |
Nutrient |
DRIS |
UC Pub. 4098 |
University of Florida |
|
Pre-harvest |
% N |
3.1 - 3.8 |
|
3.0 - 3.5 |
|
|
% P |
0.50 - 0.90 |
|
0.20 - 0.40 |
|
|
% K |
1.8 - 2.2 |
|
1.5 - 2.5 |
|
|
% Ca |
0.6 - 1.3 |
|
0.4 - 1.5 |
|
|
% Mg |
0.33 - 0.45 |
|
0.25 - 0.50 |
|
|
% S |
0.19 - 0.23 |
|
0.25 - 0.80 |
|
|
PPM B |
31 - 46 |
|
20 - 40 |
|
|
PPM Zn |
13 - 28 |
|
20 - 40 |
|
|
PPM Mn |
75 - 600 |
|
30 - 100 |
|
|
PPM Fe |
70 - 140 |
|
50 - 100 |
|
|
PPM Cu |
3.3 - 5.8 |
|
5 - 10 |
|
|
|
|
|
|
|
Main harvest |
% N |
2.4 - 3.0 |
> 3.0 |
2.8 - 3.0 |
|
|
% P |
0.30 - 0.40 |
0.15 - 1.30 |
0.20 - 0.40 |
|
|
% K |
1.3 - 1.8 |
1.0 - 6.0 |
1.1 - 2.5 |
|
|
% Ca |
1.0 - 2.2 |
0.4 - 2.7 |
0.4 - 1.5 |
|
|
% Mg |
0.28 - 0.42 |
0.3 - 0.7 |
0.20 - 0.40 |
|
|
% S |
0.15 - 0.21 |
> 0.10 |
0.25 - 0.80 |
|
|
PPM B |
40 - 70 |
35 - 200 |
20 - 40 |
|
|
PPM Zn |
11 - 20 |
20 - 50 |
20 - 40 |
|
|
PPM Mn |
65 - 320 |
30 - 700 |
25 - 100 |
|
|
PPM Fe |
85 - 200 |
50 - 3,000 |
50 - 100 |
|
|
PPM Cu |
2.6 - 4.9 |
3 - 30 |
5 - 10 |
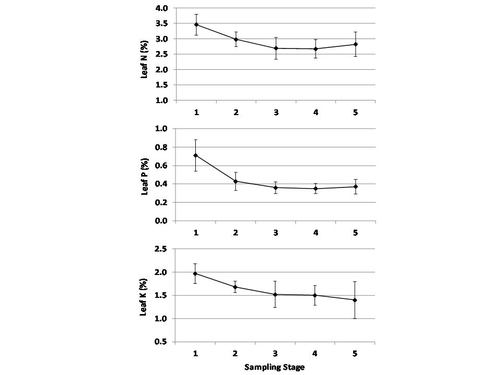
Fig. 1. Trend in leaf macronutrient concentrations over the growing season in nutritionally balanced, high yield fields; the bars indicate the DRIS sufficiency ranges.
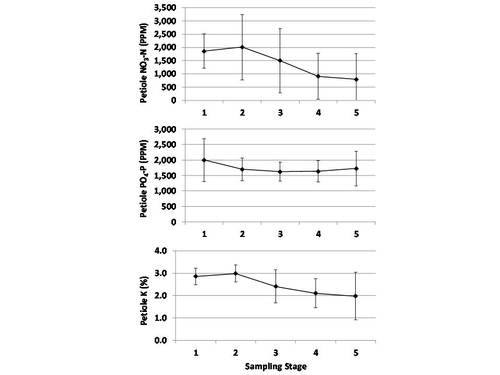
Fig. 2. Trend petiole macronutrient concentrations over the growing season in nutritionally balanced, high yield fields; the bars indicate the DRIS sufficiency ranges.
