
Posts Tagged: sulfur
Utility of Fall Applied Lime Sulfur in Reducing Incidence of Redberry Mite in Blackberry
As readers of this space already know, the utility of fall applied lime sulfur for controlling redberry mites in blackberries has been questioned. Previous collaborative work has shown that 3-4 applications of Golden Pest Spray oil at a dilution of 1.2 – 2% volume to volume applied at the 50% green fruit stage in the spring is the most effective way to control this pest in blackberry.
This past year, the authors partnered to test the thesis that fall applied lime sulfur, with and without flowable sulfur, would not have an effect on total redberry mite infestation later on in the season. The trial consisted of each treatment (no winter application, 15 gal/A lime sulfur applied twice, and 15 gal/A lime sulfur + 10 lb/A flowable sulfur applied twice) being replicated four times. In turn, each treatment replicate plot was composed of three side by side 250 foot long tunnels, with each tunnel covering three rows of blackberries (meaning each treatment replicate had nine rows of blackberries).
First application of 15 gal of lime sulfur and 15 gal of lime sulfur + 10 lbs wettable sulfur was made November 18, 2013 and the second application of the same was made January 17, 2014. In the spring, two applications each were made of of wettable sulfur (12 lbs per acre) and Golden Pest Spray oil (1.5% to 2%). All other crop and pest management procedures were made as necessary to the maintenance of the crop.
Starting June 29 and continuing weekly through the end of July for a total of six evaluations, total number of marketable fruit and redberry mite fruit were counted in a four foot long section of each three tunnel replicate plot. Statistical evaluation was done as a percentage redberry mite infested fruit compared to total amount of fruit.
As the reader can see from the data presentation below, lime sulfur used either alone or lime sulfur applied with sulfur had no effect on redberry mite incidence in the field in this study. While it is to be noted that this is a single trial run in a drought year, it nevertheless adds a good data set to the consideration of the question of the utility of fall sulfur applications for redberry mite.
|
Evaluation date |
%RBM affected fruit 6-29-2014 |
%RBM affected fruit 7-3-2014 |
%RBM affected fruit 7-10-2014 |
%RBM affected fruit 7-17-2014 |
%RBM affected fruit 7-24-2014 |
%RBM affected fruit 7-31-2014 |
|
No Winter Treatment |
2.66 |
2.66 |
3.32 |
5.01 |
12.50 |
11.99 |
|
15 gal/acre lime sulfur |
1.70 |
2.81 |
3.25 |
7.23 |
9.44 |
16.93 |
|
15 gal/acre lime sulfur + 10 lb/acre flowable sulfur |
1.94 |
3.20 |
3.73 |
7.69 |
11.82 |
13.06 |
None of the means of the percentages of redberry mite infested fruit differ significantly at the 5% level.
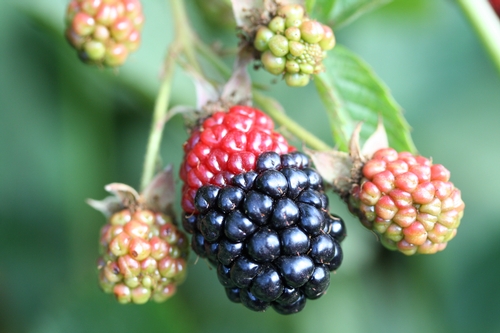
Redberry mite affected blackberry fruit. Note clear demarcation between affected, unripe druplets and those which are not.
Strawberry Plant Nutrient Sufficiency Levels Revised
It has been more than 30 years since UC published strawberry leaf nutrient diagnostic guidelines (Publication 4098, ‘Strawberry deficiency symptoms: a visual and plant analysis guide to fertilization’, released in 1980). In the years since that publication, varieties, production practices and yield expectations have changed considerably. In 2010 we began a project, funded by the California Strawberry Commission, to reevaluate leaf and petiole nutrient sufficiency ranges for day-neutral strawberries. With the cooperation of many berry growers in the Watsonville-Salinas and Santa Maria areas we collected leaf and petiole samples from more than 50 ‘Albion’ fields over the past two production seasons. In each field samples were collected 5 times over the production season, from early spring through September, to document the nutrient concentration trends from pre-fruiting to post-peak production. Leaf samples were analyzed for total concentration of nitrogen (N), phosphorus (P), potassium (K), calcium (Ca), magnesium (Mg), sulfur (S), zinc (Zn), manganese (Mn), iron (Fe) and copper (Cu). Petioles were analyzed for NO3-N, PO4-P and K concentration.
After the season cooperating growers provided yield information, which allowed us to categorize the fields as being ‘high yield’ or 'low yield’. We then applied a process called DRIS (Diagnosis and Recommendation Integrated System) to mathematically evaluate the difference in nutrient concentrations as well as nutrient ratios between high yield and low yield fields. This process allowed us to identify which of the high yield fields were ideally balanced nutritionally. From this group of nutritionally balanced, high yield fields we were able to calculate a DRIS sufficiency range for each nutrient at each growth stage.
Fig. 1 shows that leaf N, P and K concentrations were highest before harvest began (stage 1, which was late February in Santa Maria and late March in Watsonville-Salinas), and declined to a reasonably stable level throughout the main harvest period (stages 3-5, May-July in Santa Maria, June-August in Watsonville-Salinas). The decline in leaf macronutrient concentrations during the peak harvest period was expected; it happens in many fruiting crops because the leaves rapidly translocate nutrients to the developing fruit. By contrast, micronutrient concentrations either increased from early vegetative growth to the main harvest period (as was the case for B, Ca and Fe), or remained reasonably stable over the entire season (all other micronutrients). The vertical bars on each data point on Fig. 1 indicate the range of values typical of nutritionally balanced, high yield fields at each growth stage. These are the DRIS sufficiency ranges; leaf nutrient concentrations within these ranges can safely be assumed to be adequate for high yield production.
Table 1 lists the DRIS leaf nutrient sufficiency ranges for pre-harvest and main harvest growth stages. For the sake of comparison, both the sufficiency ranges given in UC Publication 4098 and the current University of Florida guidelines have been included. Although for most nutrients the ranges match pretty well, for others there are substantial differences. Where the DRIS sufficiency range is substantially higher than the other sources (Ca, Mn and Fe, for example) it is because those nutrients are in such abundant supply in our coastal soils that plant uptake is far in excess of actual plant requirement; for those nutrients a lab test result marginally below the DRIS range would not be a matter of concern.
For several nutrients (N, Zn and Cu) the DRIS sufficiency range fell below the other recommendations. We are confident that the DRIS ranges represent nutrient sufficiency because they were determined by measuring the levels common in high yield fields. The field survey approach used in this project ensured that a wide range of field conditions and grower practices were included, so the results are broadly representative of the coastal industry. Also, for all three nutrients the average leaf concentrations of the high yield and low yield groups were essentially equal, suggesting that availability of these nutrients did not limit yields.
Fig. 2 shows the trends in petiole nutrient concentrations over the season. Petiole NO3-N was so highly variable as to be nearly worthless as a diagnostic technique; during peak fruit harvest (our sampling dates 3 and 4) petiole NO3-N in high yield fields varied from < 200 PPM to 2,600 PPM. While we believe that leaf total N is a more reliable measurement, this study suggests that maintaining petiole NO3-N > 1,000 PPM pre-harvest, and > 400 PPM during peak harvest, is adequate to maintain high productivity. Given the high variability of petiole NO3-N it is possible that concentrations < 400 PPM would be adequate during the summer.
Petiole PO4-P and K were less variable than petiole NO3-N. Maintaining PO4-P > 1,200 PPM throughout the season should ensure P sufficiency. Given the high soil P availability in most coastal soils rotated with vegetable crops, this level is probably much higher than the ‘critical value’. Maintaining petiole K > 2.5% preharvest, and > 1.5% during peak harvest, appears to be adequate.
Table 1. Comparison of DRIS leaf nutrient sufficiency ranges with prior UC recommendations, and current University of Florida guidelines.
|
|
|
Nutrient sufficiency ranges |
||
|
Growth stage |
Nutrient |
DRIS |
UC Pub. 4098 |
University of Florida |
|
Pre-harvest |
% N |
3.1 - 3.8 |
|
3.0 - 3.5 |
|
|
% P |
0.50 - 0.90 |
|
0.20 - 0.40 |
|
|
% K |
1.8 - 2.2 |
|
1.5 - 2.5 |
|
|
% Ca |
0.6 - 1.3 |
|
0.4 - 1.5 |
|
|
% Mg |
0.33 - 0.45 |
|
0.25 - 0.50 |
|
|
% S |
0.19 - 0.23 |
|
0.25 - 0.80 |
|
|
PPM B |
31 - 46 |
|
20 - 40 |
|
|
PPM Zn |
13 - 28 |
|
20 - 40 |
|
|
PPM Mn |
75 - 600 |
|
30 - 100 |
|
|
PPM Fe |
70 - 140 |
|
50 - 100 |
|
|
PPM Cu |
3.3 - 5.8 |
|
5 - 10 |
|
|
|
|
|
|
|
Main harvest |
% N |
2.4 - 3.0 |
> 3.0 |
2.8 - 3.0 |
|
|
% P |
0.30 - 0.40 |
0.15 - 1.30 |
0.20 - 0.40 |
|
|
% K |
1.3 - 1.8 |
1.0 - 6.0 |
1.1 - 2.5 |
|
|
% Ca |
1.0 - 2.2 |
0.4 - 2.7 |
0.4 - 1.5 |
|
|
% Mg |
0.28 - 0.42 |
0.3 - 0.7 |
0.20 - 0.40 |
|
|
% S |
0.15 - 0.21 |
> 0.10 |
0.25 - 0.80 |
|
|
PPM B |
40 - 70 |
35 - 200 |
20 - 40 |
|
|
PPM Zn |
11 - 20 |
20 - 50 |
20 - 40 |
|
|
PPM Mn |
65 - 320 |
30 - 700 |
25 - 100 |
|
|
PPM Fe |
85 - 200 |
50 - 3,000 |
50 - 100 |
|
|
PPM Cu |
2.6 - 4.9 |
3 - 30 |
5 - 10 |
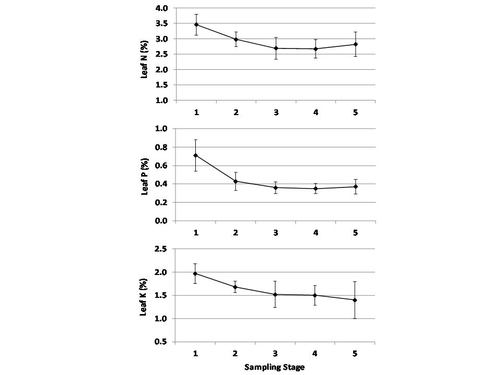
Fig. 1. Trend in leaf macronutrient concentrations over the growing season in nutritionally balanced, high yield fields; the bars indicate the DRIS sufficiency ranges.
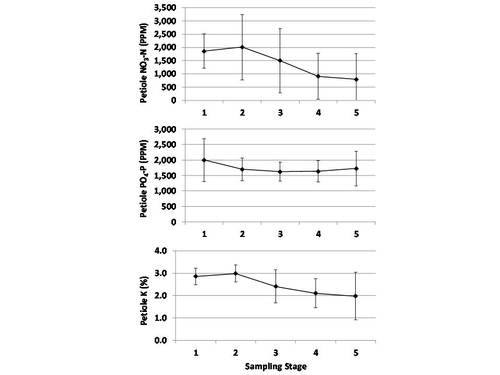
Fig. 2. Trend petiole macronutrient concentrations over the growing season in nutritionally balanced, high yield fields; the bars indicate the DRIS sufficiency ranges.
An Opinion on the Late Autumn Use of Lime Sulfur Sprays in Pajaro Valley Blackberries
In a conversation with a Pest Control Advisor colleague the other day, we discussed the merits of lime sulfur applications in the fall on blackberries grown in the Pajaro Valley. This is something I have spent considerable time thinking about and have come around to believe, that while not completely supported by empirical evidence, fall application of lime sulfur might not be necessary in our blackberries and is to some extent an artifact of past varieties and practices.
Here is why I maintain fall applications of lime sulfur might not be necessary in blackberries:
1- Redberry mite is not controlled by fall lime sulfur. It is rather controlled by post - bloom applications of horticultural oil or sulfur. This is a fact and has been tested.
2- Lime sulfur used to be critical to control cane and stem rust, Keuhneola uredinis, on the trailing Ollalieberry and continues to be very effective when applied for this disease on that variety in the fall. However, none of our current Arkansas varieties (Apache, Navajo, Choctaw and so on), nor are the proprietary suite of varieties known to be susceptible to this rust. I have yet to see it on the primocane bearing PrimeArk either. I did see a touch of orange rust on a proprietary variety last year, but this rust is not controlled by lime sulfur.
3- Do a mental exercise to test the thesis that fall lime sulfur "cleans up" the remaining blackberry cane in the fall. Mites? Not a great material for these, ditto on whitefly and aphids if they are even around. Quite effective of course on powdery mildew (NOT downy mildew), but again this pathogen is better addressed in my mind a little later in the season when the leaves emerge and fungus more active.
I would enjoy very much for someone to prove me wrong and leave replicated strips untreated with lime sulfur and see what happens next year. I believe this would be useful demonstration and quite possibly a beneficial exercise for the industry as a whole.
The use of lime sulfur is discussed extensively in this article. Before using lime sulfur or any of other pesticide, check with your local Agricultural Commissioner's Office and consult product labels for current status of product registration, restrictions, and use information.
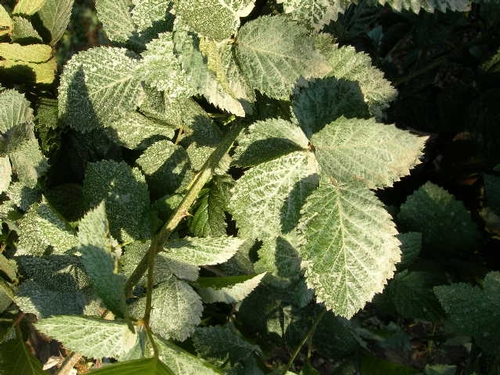
Lime sulfur residue on blackberry leaves
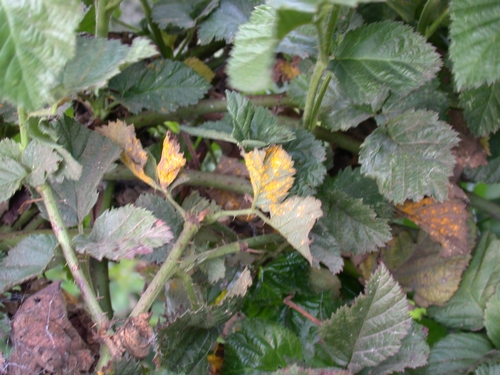
Cane and leaf rust on Ollalieberry- note lack of definition to spore clusters.
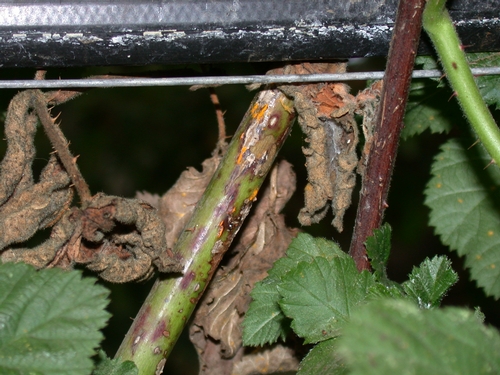
Cane and leaf rust on Ollalieberry cane.

Orange rust on Chester blackberry. Note dark orange color, clearly defined borders to spore clusters as well as waxy appearance.
Strawberry Fruit Bronzing Occurring on Coast
by Steven Koike
UC Cooperative Extension
Starting around mid-May and extending into June, strawberry growers and pest control advisors in coastal California are observing the fruit problem known as bronzing. This problem occurs every year to some extent but can result in large economic losses in some seasons. Bronzing results in a tan or bronzed discoloration on green and ripening strawberry fruit. Bronzed fruit have dried, rough surfaces that render the fruit unmarketable (Photos 1 and 2). The skin of such fruit can later crack.
There are three types of bronzing. Type I bronzing occurs on distinct, localized parts of the fruit, often beneath the fruit calyx or around the strawberry seeds (achenes), and is caused by insect feeding, primarily thrips (physical damage due to abrasion (Photo 3) is also very localized). Type II bronzing is caused by chemical sprays that cause a one-sided bronzing to the side of the fruit exposed to the application. In contrast, Type III bronzing covers virtually the entire surface of the fruit, occurs during certain periods of time, and can result in devastating crop loss. It is notable that Type III bronzing in coastal California tends to occur when the weather is sunny and warm.
Field-based research has demonstrated that Type III bronzing is associated with fruit exposure to stressful environmental conditions that include extreme solar radiation, high temperatures, and low relative humidity. This Type III problem is not caused by sulfur applications or feeding by thrips, mites, or other pests.
The problem is difficult to manage and prevent. Strawberry cultivars differ in their susceptibility to Type III bronzing, so growers should consider this factor when selecting cultivars for planting. Growing the strawberry crop so as to reduce physiological stress to the plants is a general overall recommendation. Observant growers and PCAs noted that commercial fields that happened to receive insecticide or fungicide sprays prior to a high temperature, high-sunlight intensity bronzing period had in many cases significantly lower bronzing losses compared to adjacent untreated fields. This situation likely occurred because commercial pesticides usually contain additives that protect the products from solar and ultraviolet radiation; such sprays also provided similar protection to the strawberry fruit.
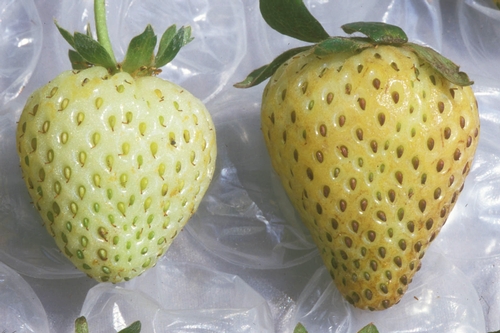
Photo Courtesy Steven Koike, UCCE
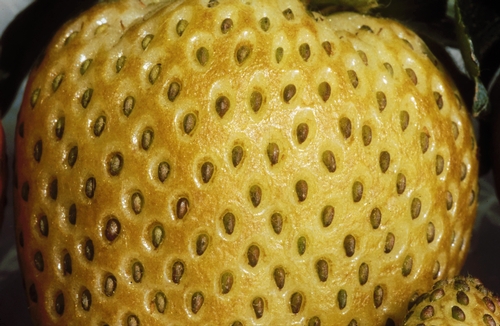
Photo courtesy Steven Koike, UCCE
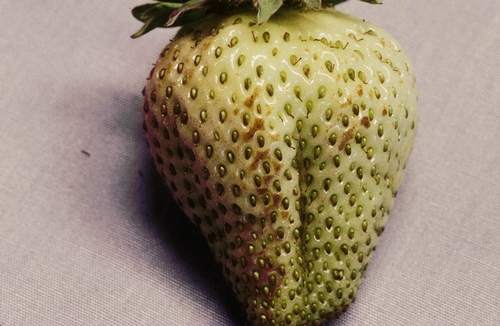
Photo Courtesy Steven Koike, UCCE
