
Closing in on an Answer on a Case of Yellow Strawberry Plants in Castroville.
Situation: The complaint we were invited to evaluate in this field was less typical than what one often finds with yellow plants in Salinas or Watsonville. These patches of yellow plants were typically dispersed in patches of various sizes in the field (photo 1 below), but on one side of the field this was particularly pronounced. This area corresponded with a farm road from a previous artichoke plantation as well as being the end of the drip tapes installed by the strawberry grower.
The bed tops tended to be dry and moisture has been adequate but not excessive, so my running thesis of excess water actually did not fit so well in this situation.
I had the good fortune on this particular call of being accompanied by Frank Shields from Soil Control Lab, who did a thorough evaluation of a bed and plant tissue (photo 2 below) and arrived at the results as depicted in photos 3 and 4 below.
Evaluation: As readers can assess from the attached analyses, this sampling was extraordinarily detailed. The soil analysis breaks down the bed into ten zones and evaluates no less than 14 parameters of each zone. Furthermore, in zone 7, Frank took a general sample of the soil texture and shrinkage, which gives an assessment of at what moisture percentage cracks form in the soil.
As a standard operating procedure, Frank sampled one bed containing symptomatic plants according to a pattern of ten different areas, the cross section of which can be seen in the soil report attached below. Additionally, Frank uprooted several plants for evaluation of the roots and tissue mineral contents in the foliage.
This soil test strives to accomplish a number of things. First, it is designed to monitor the movement and location of accumulated soluble salts for the purpose of determining the water pattern from the irrigation system. Similarly, since during the season strawberry fertilizer is supplemented via the water it is useful to know where the nutrients are ending in the bed to confirm that they are getting to the plant and not being leached out of range or being affected by adverse pH or salt conditions.
Plant available nutrients are both water soluble and exchangeable. This analysis is designed to monitor the water soluble fraction for the water soluble plant nutrients nitrate, nitrite, chloride, and sulfate as well as cations which accumulate with the water soluble fraction like calcium, potassium, sodium and ammonia.
Interpretation of Results:
Moisture: All zones were very wet indicating recent irrigation of sufficient volume to completely fill the bed and should leach salts and nutrients down and out of the bed. Additionally, there were no shrinkage cracks visible when observing the fifty foot section of row again indicating that the soil had been kept sufficiently moist.
The pH is on the high side and evenly distributed between 7.8 and 8.4 though all zones. However, this pH is not unusually high and normally would not be said to be problematic for strawberries.
Soil potassium is this sample low. It is typical for soils in Salinas and the Pajaro Valley to have potassium concentrations above 150 ppm, but with the exception of zone 10 of the bed this particular sample ranges around 50 ppm or below. This is reflected in the leaf potassium concentration of 0.9% when a range of 1.3 – 1.8% is ideal for this time of year.
Soil nitrate appears to be substantially leached out, and indeed the percentage in the leaves of the sampled yellow plants is 2.0%, which is somewhat less than the optimum of 2.4- 3.0 % for this time of year. Still, 2.0 % dry weight tissue nitrogen would not explain the substantial yellowing we observe in the field.
Phosphorous, calcium, magnesium and the other micronutrients appear to be sufficient according to the attached tissue analysis.
Nitrites, which are oxidized to plant available nitrate in the process of nitrification but toxic to plants in quantity are absent from the sample. This is quite probably because of the well aerated soil and lack of packing.
EC5: This is a measure of the amount of water soluble components in a zone. Zone six has the highest in the root zones (1 – 8) but all within values to support plant growth. With proper watering, salts should accumulate in zone six, nine and ten. In this sample, salt accumulation is highest at zone ten typical of a pattern of a bed having full mulch and plenty of water.
We can also look at the ratio of water soluble cations to get an idea on the ratio of plant available constituents like the SAR value and soluble Ca/Mg ratio. The very high sodium and chloride compared to the low calcium and magnesium in this sample is significant and indicates a problem. Indeed, sodium and chloride are excessively high in the plant tissue and very likely to be interfering with normal plant function.
Outside of the carbonates, the soil minerals are an accumulation both from the irrigation water and nutrients added to the soil. If most of the salts accumulated in the bed are naturally found in the irrigation water (as is the case here), it means that the nutrients are being leached out of the root zone with excess water and additional fertility could be considered.
Conclusion: Rather than being a problem of the deficiencies of nitrogen or potassium, Frank maintains that at issue here is a buildup in the affected areas of chloride and accumulated salts as a result of irrigation. Carrying this thesis further, perhaps if the amount of current irrigation water could be limited in the areas experiencing yellow plants, one would also be reducing the amounts of apparently damaging sodium and chloride. That might be one way to address the problem.
The scattershot pattern of yellow plants across the field is the major confounding point of the problem being evaluated here. On the one hand it would indicate that the toxicities and deficiencies described above are occurring in the same scattershot pattern across the field but it does beg the question why the differences are so dramatic, sometimes even from one plant to the next.
So, while this evaluation has given us a good look at what is going on around these yellow plants, we still don't conclusively know what exactly is the cause of this problem. It absolutely merits further work.
Thank you to the grower who invited us out. I thank Frank Shields of Soil Control Lab for the contribution of his time and expertise to working on this problem.
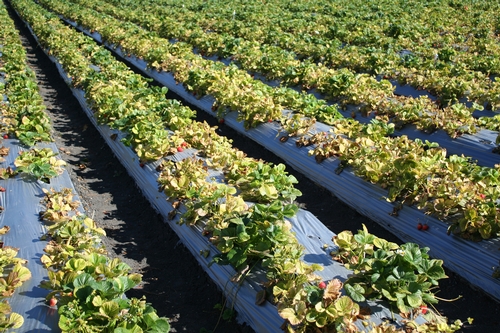
View of the situation. Yellow plants scattered among healthy green plants. Note healthy green plant in the middle of a lot of yellow ones in the bottom center of the photograph.
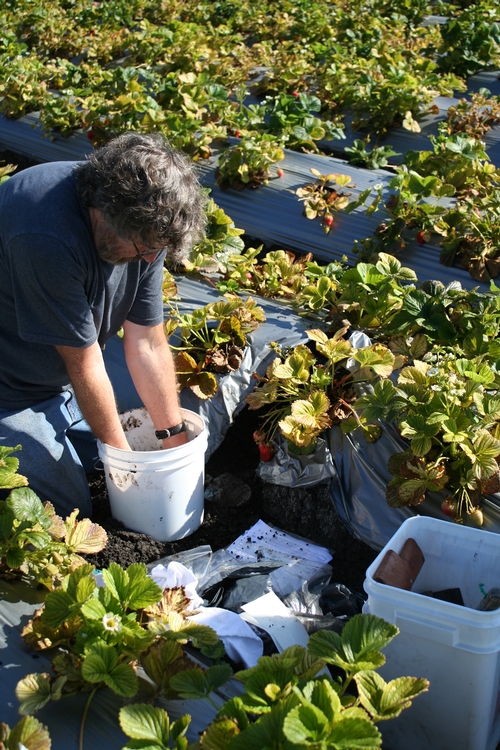
Frank Shields from Soil Control Lab sampling soil and plants.
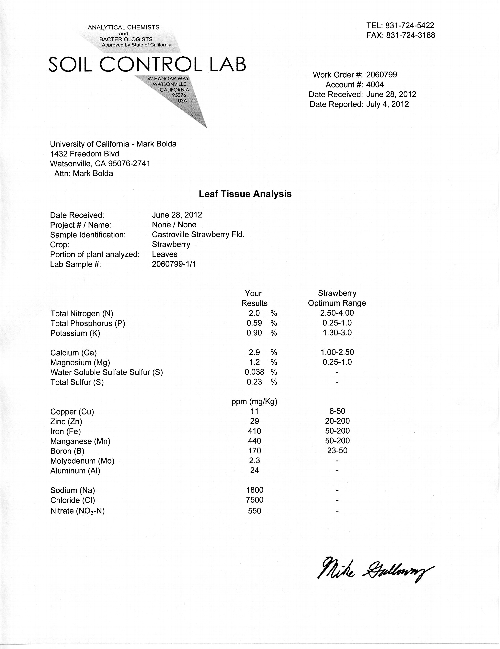
Tissue Analysis of Yellow Plant Courtesy of Soil Control Lab
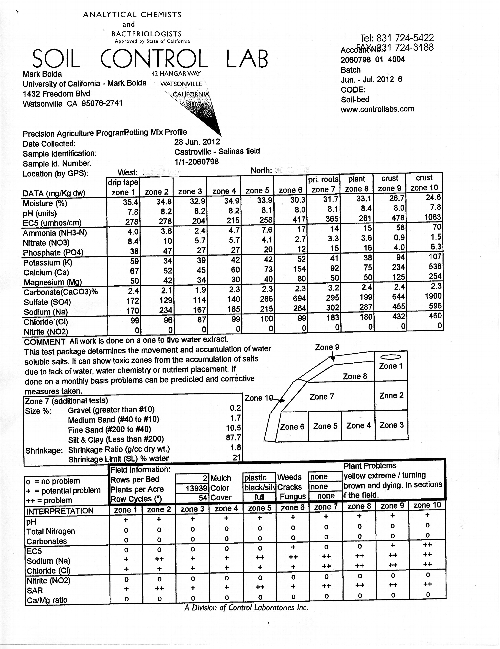
Soil Evaluation Courtesy Soil Control Lab. The diagram to the center right is a cross section of half a bed, divided into ten parts.
