
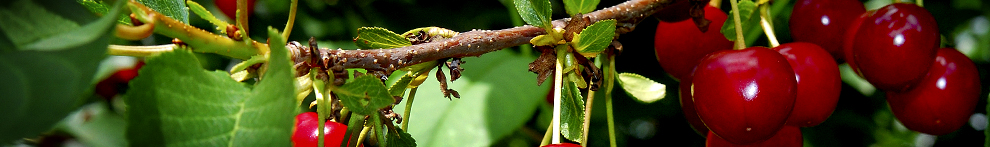
Strawberries
Year One of a Test of Biological Fungicides in Strawberries.
This is simply a summary of one year of biological fungicide work in strawberries in 2012-2013 and should not be understood as a recommendation to use any of these products. This investigation is will continue into 2013-2014 and will serve to confirm and adjust the work here.
Introduction: A number of biological fungicides registered for use in strawberries have not been thoroughly tested through empirical studies to give guidance to growers on their efficacy and use.
Materials and Methods:
Table 1 below is an outline of materials tested in 2012-2013.
The field involved in the study was organically farmed and had a tested infestation of Verticillium at the average level of 25 microsclerotia per treatment replicate. Grower standard was managed as per grower practice, that is to say normal irrigation, fertility and pest management practices were applied. This grower standard did not include any sort of biological fungicide either by dip or injection through the drip tape during the season.
Plot was replicated three times and each replicate consisted of at one bed of 180 feet in length.
Application of the materials took place as indicated in the table below:
Table 1. List of treatments.
|
Test Material |
Application/ Use |
|
Dazitol |
6.25 gal/A applied 3-5 days prior to planting |
|
Biotam + Serenade Soil |
5 lbs/A pre-plant application 3-5 days prior to planting followed by Serenade Soil @ 4 qt/A (10 days after planting, and then Serenade Soil @ 2 qt /A applied monthly after planting. Second application of Biotam 5 lbs/A and Serenade Soil @ 4 qt/A in February. |
|
Serenade Soil |
Serenade Soil @ 4 qt/A (10 days after planting, and then Serenade Soil @ 2 qt /A applied monthly after planting. |
|
Serenade Soil |
Serenade Soil @ 4 qt/A (10 days after planting, and then Serenade Soil @ 4 qt /A applied every 60 days after planting. |
|
Actinovate Rate 1 |
(1) 3 oz per 100 gal root dip at planting. (2) followed by 6 oz/A pre-plant in drip tape (3) followed by 3 oz/A every 30 days in drip tape
|
|
Actinovate Rate 2 |
(1) 3 oz per 100 gal root dip at planting. (2) followed by 6 oz/A pre-plant in drip tape (3) followed by 6 oz/A every 30 days in drip tape
|
|
SoilGuard |
Apply at planting as root dip or planting furrow drench at 5 lb/ A and again through drip tape every 4-6 weeks through harvest. |
|
Double Nickel 55 |
Apply at planting at 1 qt /A (1/2 lb/A powder) as root dip or planting furrow drench and again through drip tape every 4-6 weeks through harvest. |
|
Terra Clean 5.0 |
(1) 128 fl oz/100 gal drench (2) 2 gal/A drip applied at planting (3) 1 gal/A drip applied 10 days post plant and 28 days post plant (4) 1 gal/A drip applied 60, 90 and 120 days post plant |
|
Terra Clean 5.0 + Serenade Soil |
(1) 128 fl oz Terra Clean /100 gal drench + Serenade Soil @ 6 qt/ A soil drench (2) 2 gal/A Terra Clean drip applied at planting followed by SS @ 3 qt /A (3) 1 gal/A Terra Clean + 3 qt /A Serenade Soil drip applied 10 days post plant and 28 days post plant (4) 1 gal/A Terra Clean + Serenade Soil @ 3 qt/ A drip applied 60, 90 and 120 days post plant |
|
Tainio |
(1) Spectrum @ 50 g / A + Pepzyme C @ 12.5 oz/A 2- 3 days preplant (2) Biogenesis @ 1 lb/A+ Pepzyme C @ 12.5 oz/A as plant dip (3) Pepzyme C monthly through drip tape (4) Micro 5000 @ 2.66 oz/A at 2 leaf stage foliar |
Plant dips were made by suspending the requested rate of fungicide in approximately twenty gallons of water and submerging and soaking about a half a box of strawberry transplants (about 500 plants) thoroughly and then distributing to planting crews for transplant. Note that in the case of the two Actinovate treatments, plants were held for one night to prior to transplant, ostensibly to establish the organism on the plant roots.
Drip applications were made with a portable pump injecting each fungicide. Each application normally was preceded by filling the drip tape with clear water, injecting the mix and then further pumping in clear water to make sure the fungicide had moved well out of the drip tape.
Application dates:
Preplant application – 11/3/2012
Dazitol
Terra Clean 5.0
Terraclean 5.0 + Serenade Soil
Tainio Spectrum + Pepzyme C
Biotam
Root dip + one overnight hold – 11/7/2012 (planted November 8)
Actinovate rate 1
Actinovate rate 2
Root dip and immediate planting – 11/8/2012
Double Nickel 55
Soilguard
Biogenesis + Pepzyme C
10 days post – plant – 11/20/2012
Serenade 4 qt
Serenade 2 qt
Monthly applications (12/11/2012, 1/16/2013, 2/26/2013, 3/27/2013, 4/30/2013, and 6/13/2013)
Terra Clean 5.0
Terraclean 5.0 + Serenade Soil
Tainio Spectrum + Pepzyme C
Serenade 4 qt
Serendade 2 qt
Actinovate rate 1
Actinovate rate 2
Double Nickel 55
Biotam applied 2/26/2013; Serenade 4 qt per acre applied other dates in treatment
Soilguard
Several dying plants from different areas of the test plots were sampled in July to confirm that Verticillium was the cause of plant death.
As a gauge of plant vigor from each treatment, strawberry plant diameters were measured February 13, and April 13. Measurements were in centimeters and from twenty plants in each plot.
With the beginning of fruit ripening, fruit harvest was done weekly in each treatment replicate. On each pick date, fruit from each plot was weighed and counted.
Results:
|
|
Plant D cm 2/13/2013 |
Plant D cm 4/13/2013 |
Yield to 5/14/2013 |
April Total Yield g/plot |
|
Actinovate r1 |
14.05a |
16.25a |
3894.00a |
2175.00ab |
|
Actinovate r2 |
13.70ab |
16.42a |
3818.33a |
2428.00a |
|
Biotam |
11.47b |
15.77a |
2176.67b |
1377.00b |
|
Dazitol |
11.70b |
17.70a |
2505.67ab |
1568.00ab |
|
Double Nickel 55 |
12.65ab |
15.92a |
3084.00ab |
1637.00ab |
|
Serenade 4 qt +2 qt |
11.57b |
16.65a |
2853.00ab |
1471.67b |
|
Serenade 4 qt +4 qt |
12.42ab |
16.02a |
2621.00ab |
1459.67b |
|
Soilguard |
11.85b |
16.78a |
2993.33ab |
1652.33ab |
|
Tainio |
12.93ab |
16.95a |
3454.00ab |
2075.33ab |
|
Terraclean |
11.50b |
16.78a |
2284.00b |
1406.67b |
|
Terraclean + Serenade |
12.47ab |
17.11a |
2656.33ab |
1559.67ab |
|
Untreated grower standard |
11.70b |
17.90a |
2145.00b |
1189.00b |
Means followed by same letter do not significantly differ (P=.05, Student-Newman-Keuls)
|
|
May Total Yield g/plot |
June Total Yield g/plot |
July Total Yield g/plot |
Aug Total Yield g/plot |
Total Yield g/plot |
|
Actinovate r1 |
3741.67a |
2791.00a |
1902.33a |
140.64a |
16820.67a |
|
Actinovate r2 |
3069.67a |
3237.67a |
2812.33a |
149.35a |
17201.34a |
|
Biotam |
2254.00a |
3251.33a |
3402.00a |
503.14a |
14468.33a |
|
Dazitol |
2514.67a |
3075.33a |
3049.33a |
269.16a |
14625.00a |
|
Double Nickel 55 |
3038.67a |
2837.67a |
2573.67a |
203.64a |
15052.67a |
|
Serenade 4 qt +2 qt |
3244.67a |
3287.00a |
3623.67a |
371.49a |
16887.67a |
|
Serenade 4 qt +4 qt |
2959.67a |
3617.67a |
3236.33a |
362.02a |
16157.00a |
|
Soilguard |
3212.33a |
3331.67a |
2887.00a |
359.45a |
16352.33a |
|
Tainio |
3409.00a |
3687.33a |
3190.33a |
170.27a |
18145.00a |
|
Terraclean |
2496.67a |
2997.00a |
2750.00a |
125.01a |
13681.33a |
|
Terraclean + Serenade |
2544.00a |
2810.00a |
2230.00a |
191.78a |
13454.33a |
|
Untreated grower standard |
2812.00a |
4019.33a |
3800.00a |
306.15a |
16150.33a |
Means followed by same letter do not significantly differ (P=.05, Student-Newman-Keuls)
Plant diameters measured on February 13, 2013, were significantly larger in the low rate of Actinovate than the other treatments with the exception of the high rate of Actinovate, Tainio and Double Nickel 55.
Both rates of Actinovate realized higher fruit yield than all other treatments except for the Dazitol, in cumulative fruit yield, which included six weekly harvests, up to May 14, 2013. No further differences were realized between May and August.
As noted above, this field has a very high infestation of Verticillium and all plots began to experience pronounced plant dieback in June, with some 60-80% remaining alive or declining and by end of July, nearly all plants in all replicate plots had died. There was a trend for plants which had produced larger amounts of fruit in April and May to experience lesser fruit production lesser vigor and earlier dieback as the season progressed.
Conclusion
The results of this trial are encouraging. In the early part of the season up through the middle of May, several treatments had significantly higher amounts of fruits harvested than the grower standard. Nonetheless, none of the treatments provided sufficient protection to the plants to prevent an almost complete die out of the plants by August, effectively ending the season.
Tour of San Francisco - Bay Area Markets Offered
It’s not easy for a farmer who is used to selling direct at farmers markets, a roadside stand, or to a processor to make the big step into selling boxed and labeled product to wholesale and other buyers. Yet these buyers really want to meet small farmers so they can serve the rapidly expanding market for locally grown food. The University of California Cooperative Extension offices in Santa Cruz and Santa Clara Counties, along with the Agricultural Sustainability Institute at UC Davis are planning to connect these farmers and buyers from the San Francisco Bay Area during a bus tour on Tuesday, November 5.
Farmers who want to join the bus tour need to pre-register by contacting UC Cooperative Extension Santa Cruz County at telephone (831) 763-8040; email cesantacruz@ucdavis.edu or by stopping by the office at 1432 Freedom Blvd in Watsonville. There is a $20 registration fee, which is fully refundable upon boarding the bus.
The day long tour will leave UC Cooperative Extension in Watsonville at dawn, pick up more growers in San Martin on the way to San Francisco, then tour the San Francisco Produce Market and see different kinds of buyers in the area. The farmers will also visit an independent retailer who buys direct as well as a foodservice or restaurant buyer. The tour will be a “workshop on wheels” where participants will learn about food safety requirements and credit and loan opportunities. Farm Credit banks, which have provided support for the tours, will have a representative on board to discuss financing options.
Link to further information and registration is provided here:
http://cesantacruz.ucanr.edu/files/174315.pdf
Fresh Market Blackberry Cost and Return Study Now Available from UC Cooperative Extension
The new edition of "Sample Costs to Establish and Produce Fresh Market Blackberries Study" is now available from UCCE.
http://coststudies.ucdavis.edu/files//2013/09/30/blackberrycc2013.pdf
This is another great cost and return study in berries authored by Laura Tourte, Rich De Moura, Karen Klonsky, and yours truly.
We certainly weren't in alone in writing this study, and this work could not have been accomplished without the substantial input and contributions from local blackberry growers - thank you all!

2013 Cost and Return Study now available for fresh market blackberries on the Central Coast.
University of California Announces Soil Fertility Short Course for October 23
The UC Vegetable Research & Information Center (VRIC) will sponsor the UC Soil Fertility Short Courseon Wednesday, October 23, 2013 at the Buehler Alumni & Visitor Center, UC Davis. The short course will focus on the practical aspects of soil fertility management and topics will include soil testing, interpretation of laboratory soil test results, comparing fertilizer sources, developing crop nutrient management plans, and fertilizer management and environmental protection. The content will be geared toward commercial scale production, and will assume a general knowledge of soil science; this course is not appropriate for home gardeners.
The program is intended for growers, certified crop advisers (CCA), pest control advisers, government agency personnel, and others involved in fertility management planning. Take advantage of the early-bird registration fee ($160.) The fee goes up on Oct. 4 to $190. The registration fee includes lunch, refreshments and study materials. UC Farm Advisors can attend at the special rate of $95. Enrollment limited to 70 attendees.
Cooperative Extension specialists Tim Hartz (vegetable crops) and Stu Pettygrove (soils) are the instructors.
The course is approved for California CCA continuing education credits. No DPR credit available for this course.
More information, visit the VRIC website (http://vric.ucdavis.edu).
Farm Call: Nitrogen deficiency in strawberry
I was brought out to the situation in strawberry pictured below. Yellowing leaves and very little flowering or fruiting. For whatever reason, the street’s call on this was that it is iron, but to me the youngest leaves being as green as they are (Photo 2 below), is a dead giveaway that it’s not iron, because the youngest leaves in iron deficient plants are the first to yellow, not the last.
No sense standing around arguing about the problem, we just have to roll up our sleeves, get dirty and figure it out!
The charts below are threefold replicates of sampled leaves and soil of affected plants in the field.
Table 1 : Tissue analysis
|
Nutrient |
Sample Concentration |
|
Nitrogen |
1.4 % |
|
Phosphorous |
0.32 % |
|
Potassium |
1.33% |
|
Calcium |
2.5% |
|
Magnesium |
0.38% |
|
Sodium |
197 ppm |
|
Sulfur |
0.09 % |
|
Chloride |
7930 ppm |
|
Copper |
3.7 ppm |
|
Zinc |
17 ppm |
|
Iron |
270 ppm |
|
Manganese |
187 ppm |
|
Boron |
49 ppm |
|
Molybdenum |
1 ppm |
Table 2: Soil analysis
|
Soil Component |
Sample Concentration |
|
Nitrate (NO3-N) - ppm |
4.1 |
|
Ammonia (NH3-N) - ppm |
5.4 |
|
Phosphorous - ppm |
99.3 |
|
Potassium – ppm |
306 |
|
Calcium – ppm |
3800 |
|
Magnesium – ppm |
1100 |
|
Sodium – ppm |
96 |
|
Chloride – meq/L |
0.87 |
|
SAR |
1.0 |
|
Zinc -ppm |
2.6 |
|
Iron - ppm |
36.4 |
|
Manganese - ppm |
3.8 |
|
Boron- ppm |
0.82 |
|
Soil pH |
6.7 |
|
Percent carbonates as CaCO3 |
0.56 |
So, it looks like the main culprit here is indeed a lack of nitrogen, seeing that at an average of 1.4% it is well under the 2.4% tissue concentration threshold given in the UCCE nutrient guidelines. Just to be sure though, we should check to see if any of the other nutrients are low, but they are not and everything else is within normal ranges. I would have some concern about the high levels of sodium (197 ppm) and chloride (7930 ppm), but beyond some marginal burning of the leaves, these plants don’t seem to be exhibiting symptoms consistent with real salt poisoning.
Looking to the soil, sure enough we get confirmation of what we are seeing at the tissue level, and see that nitrates are pretty low here, running at a lean 4 ppm. I would probably want to bump that up a bit.
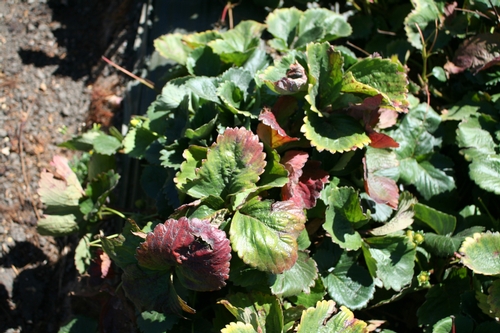
Photo 1: Plants exhibiting yellow coloration late in the season.
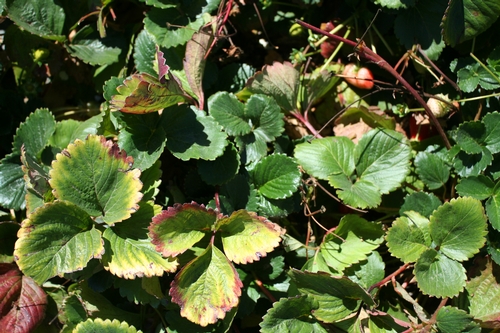
Photo 2: Strawberry leaf yellowing, but note how green and fresh the new leaves look - a real tell for nitrogen deficiency. Margin discoloration and burning of the older leaves sure to be a product of the high levels of sodium and chloride.
