
Posts Tagged: nitrate
Changes to Soil Following Application of Mustard Seed Meal and Crab Meal
Below is a look at what happens to a soil following application of mustard seed meal (MSM) at 1.5 T per acre and mustard seed meal (again 1.5 T per acre) + crab meal (500# per acre) as separate treatments two weeks after fumigation with Ally 33 (67% AITC, 33% chloropicrin applied at 340# per acre on Oct 7).
Grower standard was methyl bromide/chloropicrin applied at 350# per acre. Planting took place Nov 3.
A soil sample taken on Nov 7 did not show differences in soil aspects analyzed between any of the treatments, although ammonium - N concentrations were surprisingly high (30 ppm and up) and nitrate - N numbers tended to be quite low (6 ppm and below).
Remarkably, look what has happened in the 4 weeks since that sample. Bear in mind that the grower has since sprinkled overhead several times and we had a good amount of rain as well. Commenting continues below the tables.
Unless otherwise indicated, units are in ppm of dry soil.
Table 1A. Soil analysis from December 7, 2016
|
Sample |
pH |
EC (dS/m) |
Nitrate – N |
Ammonium – N |
|
Methyl bromide grower standard |
7.4 |
0.9 |
11.3 |
4.7 |
|
Mustard Seed Meal |
7.1 |
1.7* |
34* |
20* |
|
Mustard Seed Meal + Crab Meal |
7* |
1.8* |
32* |
12* |
*Student's T-Test; different from grower standard at 5% level of significance.
Table 1B. Soil analysis from December 7, 2016
|
Sample |
(P) |
(K) |
(Ca) |
(SO4) |
(Mg) |
(Mn) |
Fe |
Na in meq/L |
Cl in meq/L |
|
Methyl bromide grower standard |
51 |
148 |
3100 |
278 |
178 |
8.9 |
18 |
1.9 |
3.2 |
|
Mustard Seed Meal |
54 |
190* |
2933 |
318 |
193 |
19.2* |
16 |
1.5 |
1.9 |
|
Mustard Seed Meal + Crab Meal |
60 |
185* |
3100 |
589 |
150 |
20.1* |
16 |
1.5 |
1.9 |
*Student's T-Test, different from grower standard at 5% level of significance.
One sees immediately that the pH has fallen, even significantly, in plots treated with mustard seed meal and mustard seed meal + crab meal. This is not surprising, since in the month's time since the initial sample on Nov 7, the ammonium has clearly nitrified (releasing 2 H+ ions per molecule, in turn acidifying the soil) creating a big pool of nitrates which have gone up significantly over the grower standard.
EC has gone up a bit due to the higher nitrates (NOT because of sodium or chloride), and interestingly levels of manganese (Mn) a mineral sensitive to acidification apparently, have soared in both MSM treated plots. Levels of available potassium (K) have gone up significantly also in MSM treated plots.
Quite interesting on the whole. By the way, a soil report like this makes for pretty good reading, and outside of the EC which is for the time being a little high in the MSM plots, all the other numbers are right where I like to see them.
Stay tuned on this one; we are following all of this trial through the season.
Arrival at a Probable Cause of Yellow Strawberry Plants in Castroville
Introduction: The following is a description of a second, more thorough evaluation of the situation described previously in this space of yellow strawberry plants in a field in Castroville. This issue of yellow strawberry plants popping up in certain locations in the Castroville – Salinas production area has confounded us for years, but I believe the work described below allows us to make a strong argument as to the cause is of this malady at least in this case.
Materials and Methods: A total of four samples (two from an area of severe yellowing, and two from an area of apparently healthy green plants) were taken. Following the output example posted below (Figure 2), each sample consists of 10 zones of a bed, and each zone is tested for 14 parameters. At each soil sampling site, a representative plant sample was uprooted and taken away for analysis of tissue mineral concentration.
Results: The data in the Tables 1 and 2 below represent an average of the two samples taken each for yellow and green plants. In order to better interpret the data, several zones have been grouped together. Zones 9 and 10 represent the surface of the bed, zones 1, 2 and 3 represent the soil straight underneath the drip tape, zone 8 the plant zone, zone 7 the root zone and zones 6, 5 and 4 being underneath the root zone 7.
Table 1: Evaluation of Zones 1- 6 of Bed in Yellow and Healthy Areas
|
Data (mg/Kg dw) |
Zones 1,2 and 3 |
Zones 4,5 and 6 |
||
|
|
Yellow |
Healthy |
Yellow |
Healthy |
|
Moisture (%) |
33.7 |
33.6 |
29.8 |
31.8 |
|
pH (units) |
8.5 |
8.1 |
8.5 |
8.1 |
|
EC5 (umhos/cm) |
269 |
267 |
381 |
355 |
|
Ammonia (NH3-N) |
24 |
32 |
60 |
16 |
|
Nitrate (NO3) |
204 |
49 |
443 |
94 |
|
Phosphate (PO4) |
126 |
86 |
66 |
68 |
|
Potassium (K) |
157 |
184 |
157 |
92 |
|
Calcium (Ca) |
419 |
417 |
398 |
201 |
|
Magnesium (Mg) |
169 |
375 |
174 |
130 |
|
Carbonate (CaCO3) % |
2.3 |
1.8 |
2.7 |
1.7 |
|
Sulfate (SO4) |
219 |
195 |
694 |
412 |
|
Sodium (Na) |
454 |
417 |
578 |
426 |
|
Chloride (Cl) |
175 |
184 |
181 |
242 |
|
Nitrite (NO2) |
0 |
0 |
0 |
0 |
Table 2: Evaluation of Zones 7-10 of Bed in Yellow and Healthy Areas
|
Data (mg/Kg dw) |
Zone 7- Root Zone |
Zone 8- Plant Zone |
Zones 9 and 10 |
|||
|
|
Yellow |
Healthy |
Yellow |
Healthy |
Yellow |
Healthy |
|
Moisture (%) |
30.6 |
32.1 |
33 |
33.1 |
22.8 |
26.3 |
|
pH (units) |
8.7 |
8.2 |
8.7 |
8.3 |
8.3 |
8.2 |
|
EC5 (umhos/cm) |
305 |
389 |
258 |
374 |
938 |
546 |
|
Ammonia (NH3-N) |
34 |
14 |
54 |
16 |
48 |
44 |
|
Nitrate (NO3) |
314 |
30 |
199 |
25 |
968 |
452 |
|
Phosphate (PO4) |
6.5 |
57 |
85 |
55 |
111 |
45 |
|
Potassium (K) |
144 |
74 |
185 |
89 |
206 |
89 |
|
Calcium (Ca) |
341 |
156 |
713 |
194 |
512 |
195 |
|
Magnesium (Mg) |
140 |
83 |
383 |
127 |
384 |
104 |
|
Carbonate (CaCO3) % |
2 |
1.3 |
2.0 |
1.9 |
2.0 |
1.9 |
|
Sulfate (SO4) |
434 |
492 |
239 |
437 |
1216 |
622 |
|
Sodium (Na) |
500 |
446 |
492 |
496 |
872 |
520 |
|
Chloride (Cl) |
160 |
309 |
165 |
330 |
433 |
310 |
|
Nitrite (NO2) |
0 |
0 |
0 |
0 |
0 |
0 |
Table 3: Comparison of Mineral Concentrations of Leaf Tissue for Green and Yellow Plants
|
Mineral |
Yellow Plant |
Green Plant |
|
Total Nitrogen |
2.4% |
2.2% |
|
Total Phosphorous |
0.38% |
0.44% |
|
Potassium |
1.1% |
1.2% |
|
Calcium |
1.5% |
1.3% |
|
Magnesium |
0.55% |
0.38% |
|
Total Sulfur |
0.21% |
0.18% |
|
Copper |
4.5 ppm |
3.7 ppm |
|
Zinc |
23 ppm |
18 ppm |
|
Iron |
515 ppm |
365 ppm |
|
Manganese |
185 ppm |
108 ppm |
|
Boron |
73 ppm |
78 ppm |
|
Molybdenum |
1.1 ppm |
1.9 ppm |
|
Sodium |
350 ppm |
79 ppm |
|
Chloride |
4150 ppm |
3000 ppm |
I’ve also taken a look at the irrigation water. As is common in northern Monterey county, the farm gets its water as a mixture of recycled water blended with well or river water. A full report for an example of the blended irrigation water used on this farm is available from the Monterey Regional Water Pollution Control Agency at:
http://www.mrwpca.org/recycling/chem2012_blended.php
In the sample taken of the blended recycled and river water mix, conductivity (EC) was 1.3 dS/m, sodium 118 ppm, chloride 160 ppm and adjusted SAR of 3.4 (sodium adsorption ratio, an index of sodium hazard adjusted for the amount of calcium in the irrigation water).
Discussion: The pH of the soil in the beds in all zones is quite high, which is not surprising because of the high percentage of carbonates (lime) throughout. One can also see accumulations of nitrates, phosphates and potassium are substantially higher in the areas of the yellow plants, which quite likely due to their declining ability to take up the nutrients being continually applied as fertilizer. It is worth noting that nitrates in the high concentrations found in our soil tests can be toxic to plants, thus accelerating the decline of plants.
Nitrites, generated from ammonium in anaerobic conditions, are zero, indicating adequate aeration in the bed.
In terms of the irrigation water, referring to the water quality guidelines for crops developed by UC Cooperative Extension, we find that the water used on this farm can be used with some restriction to irrigate crops moderately susceptible to salinity such as strawberry. In other words, this irrigation water isn’t great but is OK.
It seems that the real culprits in this field are the accumulated amounts of chloride and sodium. Generally speaking, crops in our area perform best when the soil sodium levels are less than 250 ppm and soil chloride levels are less than 100 ppm.
Across all the soil samples the average amounts of sodium and chloride are above 250 ppm and 100 ppm respectively. High as they are, the concentrations of both ions do not vary greatly in the plant and root zones and the zones around them in either areas of green or yellow plants. There are, however, substantial differences in the concentrations of these ions at the crust (zones 9 and 10) between green and yellow plant areas. For example, on average soil from areas of yellow plants there is nearly a twofold accumulation of sodium in the crust of soil taken as well as a substantially higher amount of chloride over the soil sampled around green, healthy plants. This tells us that while these large amounts of sodium and chloride (also known as salts) are accumulating away from the plant via evaporation, they are nevertheless passing through more sensitive plant zones to get there. It is not difficult then to hypothesize that during this transition the yellow plants are picking up these salts obtaining the fourfold accumulation of sodium and 40% increase in chlorides that we observe in the leaf tissue of yellow plants over that of green.
Furthermore, it is notable that the amount of lime (CaCO3) in all the soil samples is high. This indicates that a lot of calcium coming into the soil from irrigation water is precipitating out and not as capable of sufficiently limiting the amount of exchangeable sodium. In turn the sodium hazard is high. This may also explain to some extent why areas quite close to one another respond differently, since in some areas (perhaps even quite close together) more calcium precipitates out than others.
My conclusion drawn from all this work in this particular instance of severe plant yellowing of strawberry plants is that the uptake of sodium and chloride by these affected plants is very high and they are being poisoned by salt.
Thank you to Frank Shields and Soil Control Lab for their generous assistance in this work. Thanks to other colleagues for their valuable insight and input which assisted me in the development of my conclusion.
This project was supported in part with funds provided by the California Strawberry Commission.
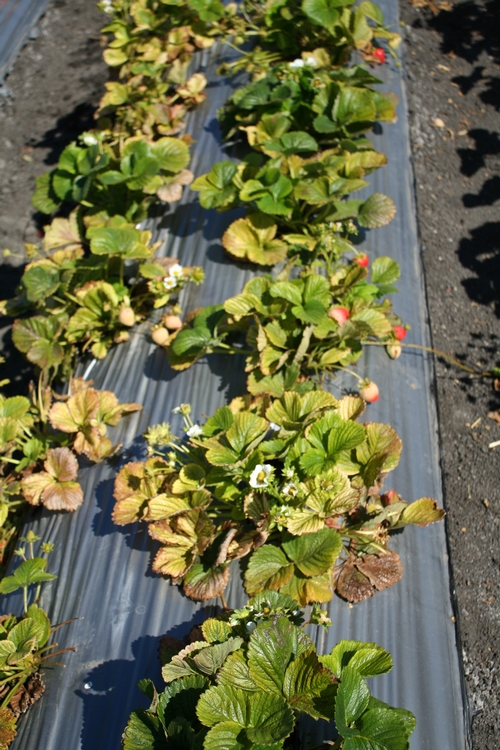
Picture of yellow strawberry plants in Castroville field. Note washed out, almost bleached appearance coupled with uneven distribution in affected area.
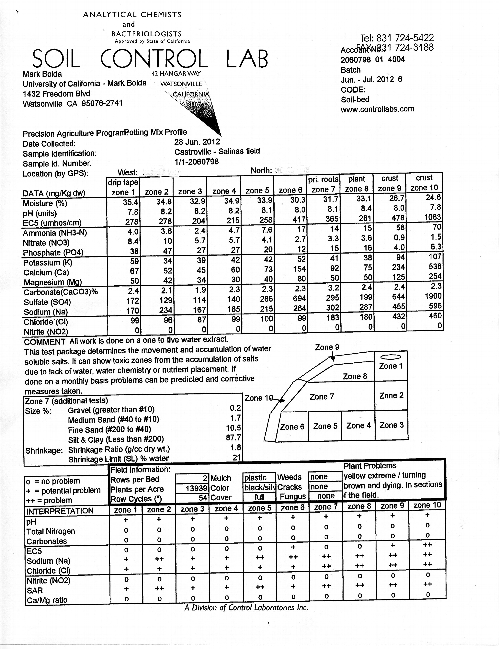
Example of output from soil tests from ten distinct zones of the bed, use graphic to understand Tables 1-2 above.
The Postscript to Last Week’s Blog Article about Salt Damage
As a postscript to last week’s post regarding salt and ammonium damage to area strawberry plantings, I will outline the results of the soil samples taken from a field demonstrating the symptoms described in that article.
Steve Koike and I collected soil samples from the affected field last Thursday, January 5. Soil samples were collected from four blocks, one of which had been overhead irrigated the day previous, and consisted of composites of at least five 5” deep samples taken from around the fertilizer band by the plant roots.
Samples were immediately taken to Soil Control Lab in Watsonville for analysis.
Results are as follows:
|
|
Nitrate (ppm) |
Ammonium (ppm) |
EC (dS/m) |
|
Sample 1 (not overhead irrigated): |
58 |
4.8 |
2.8 |
|
Sample 2 (not overhead irrigated): |
72 |
5.2 |
4.2 |
|
Sample 3 (not overhead irrigated): |
69 |
4.8 |
3.8 |
|
Sample 4 (overhead irrigated): |
24 |
5.1 |
2.2 |
The results are pretty clear in showing that the block (Sample 4 ) which had been watered by overhead irrigation had three times lower nitrate concentrations and about half the EC (which is electrical conductivity, a measure of salt) of the other three averaged as a group, but more equivocal on the reduction of ammonium.
To interpret the data in the table above, we can refer to work done some time ago which demonstrated EC’s in excess of 1.0 were related to loss in yield of strawberry, suggesting that real damage could occur at the 4x levels in the table above.
