
Strawberries
Micronutrient deficiency in raspberry
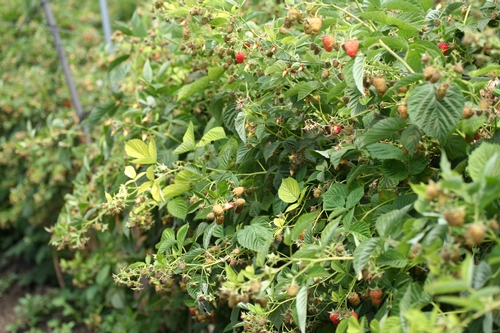
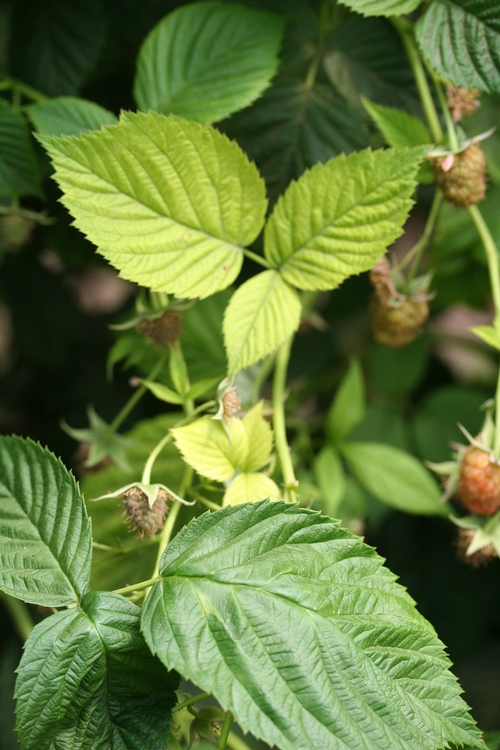
Two weeks I was called out to investigate the situation in organically farmed red raspberry that the reader can see below. The plants are pushing forth an impressive crop of fruit and overall the plant stand is strong yet numerous laterals are showing a yellowing of the leaves, especially towards the tips.
The Problem: The youngest leaves on the ends of fruiting laterals were showing a distinctive yellowing. Looking closely at affected leaves, one can see that the veins of the affected leaves remain green to some extent.
Field Evaluation: The farm manager and I initially looked around for arthropods (insects and mites) or damage as well as extirpating a few plants to examine the roots and generate samples for submission to the UCCE diagnostic laboratory in Salinas.
We then took 4 replicated samples of yellow leaves and then four replicated samples of green leaves from the same stage (between the 5th and 7th leaf from the tip) of apparently healthy laterals. We also took soil samples down to about six inches deep from four distinct areas of the field. All samples were submitted to the Soil Control Laboratory in Watsonville for analysis.
Results:
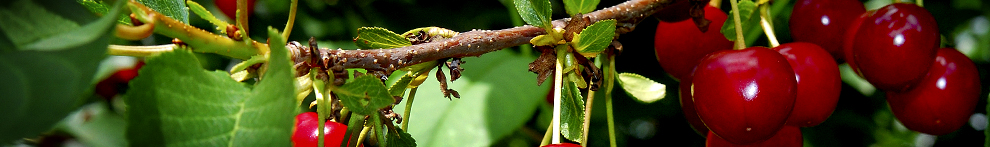
No arthropods of any consequence were found during our visit, nor did the UCCE diagnostic laboratory come up with any plant pathogens. The mycelial threads we found on the crown and roots (last photo below) of the cane are those of a saprophytic fungus and present no threat to the plant.
The means of the replicated tissue samples were compared through a Student’s t-test and the results are presented below in Table One.
Table One. Average Mineral Concentration of Green and Yellow Leaves
|
Mineral |
Green Leaves |
Yellow Leaves |
T-test p value |
|
Total Nitrogen (%) |
2.825 |
2.875 |
0.4950 |
|
Total Phosphorous (%) |
0.19 |
0.2025 |
0.2394 |
|
Potassium (%) |
1.425 |
1.925 |
0.0088 |
|
Calcium (%) |
1.675 |
1.375 |
0.0462 |
|
Magnesium (%) |
0.4525 |
0.375 |
0.0139 |
|
Sulfur (%) |
0.165 |
0.15 |
0.1817 |
|
Copper (ppm) |
4.725 |
4.625 |
0.7629 |
|
Zinc (ppm) |
14.25 |
14 |
0.3910 |
|
Iron (ppm) |
530 |
380 |
0.0270 |
|
Manganese (ppm) |
42.75 |
21.25 |
0.0016 |
|
Boron (ppm) |
73.25 |
68.5 |
0.2777 |
|
Molybdemum (ppm) |
1.625 |
1.55 |
0.7680 |
|
Sodium (ppm) |
172.5 |
167.5 |
0.1817 |
|
Chloride (ppm) |
5250 |
3125 |
0.0520 |
|
Nitrate (ppm) |
1115 |
1800 |
0.3185 |
As one can see, there are several minerals, being magnesium, manganese, calcium and iron, which are significantly lower (p<0.05) in concentration in the yellow leaves than in the green. Conversely, potassium is much higher in the yellow than in the green.
The unfortunate thing is that since we don’t have published guidelines for these sorts of raspberry varieties (for example like the recently published DRIS study in strawberry), we have to refer to out of state raspberry fertility guidelines for other varieties to get a handle on the meaning of all these numbers. Using these guidelines, we find that the concentration of manganese in the yellow leaves falls below the consensus of a lower threshold of sufficiency of about 30 ppm. In contrast, concentrations of iron, calcium, and magnesium, even though they are significantly lower in the yellow leaves than the green, are still within the generally accepted ranges of sufficiency.
We do get a glimpse also of the tolerances of these raspberry plants to chloride and sodium, which can be useful for future reference. The green leaves contain about 5000 ppm chloride and around 170 ppm sodium. These concentrations in my experience would be cause for some plant distress in strawberry, but apparently these levels are fine here.
The averages of the soil samples are below. As there was no area in the field showing more yellow than others, simply four composites of six individual samples were taken to get an understanding of the background mineral concentration of the soil.
Table Two. Average Mineral Concentrations of Soil
|
Mineral |
Soil Concentration |
|
NO3-N (ppm) |
10.83 |
|
NH3- N (ppm) |
5.70 |
|
Phosphorous (ppm) |
102.00 |
|
SP (%) |
59.33 |
|
pH |
7.63 |
|
ECe (dS/m) |
0.91 |
|
Calcium (meq/L) |
4.73 |
|
Magnesium (meq/L) |
2.37 |
|
Sodium (meq/L) |
1.63 |
|
Potassium (ppm) |
0.49 |
|
Chloride (meq/L) |
1.83 |
|
SO4-S (meq/L) |
2.40 |
|
SAR |
0.87 |
|
Boron (ppm) |
0.65 |
|
Copper (ppm) |
1.53 |
|
Zinc (ppm) |
4.77 |
|
Iron (ppm) |
27.67 |
|
Manganese (ppm) |
3.90 |
Nothing jumps out here from this table of soil concentrations. Nitrates might be a tad lean at 10 ppm, phosphorous is typically high, pH is normal, ECe is a comfortable 0.91 and the micronutrients are available in some quantity.
The question is then what is the conclusion? We have no arthropod or pathogen compromising the plants ability to take up nutrients or anything else. Lacking any other explanation, my take would be twofold. One is that the pH of 7.6 in the soil is limiting the manganese, and that the big fruit load could be also drawing off this nutrient from the leaves and moving them to the fruit. My choice of corrective action would be to add manganese, along with iron and magnesium, just to be sure, to this planting.
Thanks to Patrick Kingston and his boss for having me out on this call. It’s always great to collaborate on issues with such enthusiastic and smart up and comers in our industry.
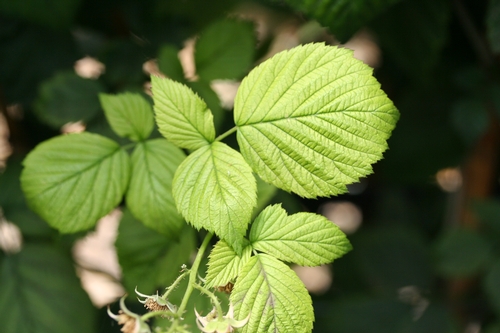
Young yellow leaves.
Good example of remaining green color of leaf veins.
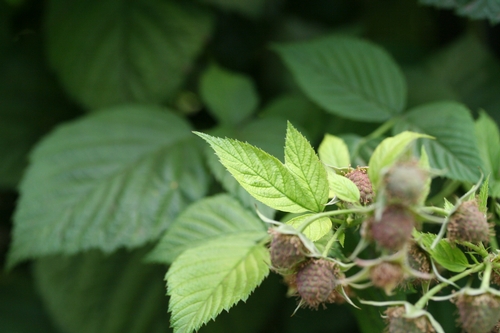
Massive fruit load, interspersed with yellow leaves at tip of lateral.
Healthy green leaf contrasted with the yellow leaves of another lateralbehind it.
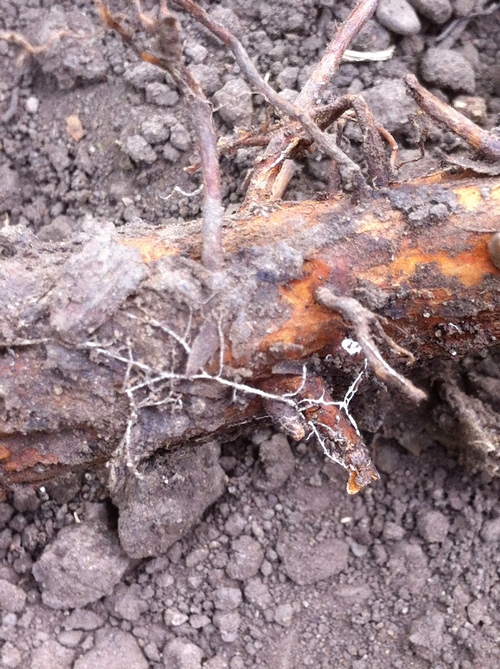
Thread of mycelia on crown of raspberry cane. Not a pathogen, instead a harmless saprobe.
An Evaluation of the Theory of Target Pest Surface Area to Mass Ratio to Actual Pest Management Practice
A very important concept for all pest managers to understand is that the smaller the target insect is, the higher the ratio of surface area of its body becomes in comparison to its mass. Since most insecticides are applied to the surface of the insect, this theoretically means that one is able to deliver a higher dose of insecticide per unit weight of the smaller insect than the larger and subsequently control the smaller more readily.
To demonstrate, let us approach the problem mathematically.
Let us take a lygus nymph compared to a lygus adult. To simply the math, we assume both bug stages are completely spherical:
Surface area small nymph (1 mm radius): 12.6 sq mm
Volume small nymph: 4.2 cubic mm
Surface area adult (3 mm radius): 113 sq mm
Volume adult: 113 cubic mm
Now let us examine what happens when we spray each insect with a thin sheet of water of thickness 0.001 millimeter and consisting of 1% poison and which perfectly covers the surface area of both the lygus nymph and adult.
So, continuing with our calculations, the amount poison applied to the small nymph:
0.001 mm thickness of water sheet x 12.6 sq mm surface area = 0.0126 cubic mm water x 1% poison = 0.000126 cubic mm poison to the small nymph.
Divide the cubic mm volume poison by the volume of the small nymph:
0.000126 cubic mm poison/4.2 cubic mm = 0.00003 cubic mm poison per cubic mm pest
Amount poison applied to the adult:
0.001 mm thickness water x 113 sq mm surface area = 0.113 cubic mm water x 1% poison = 0.00113 cubic mm poison to the adult (10 times the poison as the small nymph!)
Divide the cubic mm volume poison by the volume of the adult:
0.00113 cubic mm poison/113 cubic mm = 0.00001 cubic mm poison per cubic mm pest.
Let us express cubic mm as milligrams (mg) as is often done (1 cubic mm water = 1 mg = 1 ml) to simplify the concluding explanation:
So, the 0.00003 mg poison per mg pest for the small nymph is 3 times the amount of 0.00001 mg poison per mg pest of the adult.
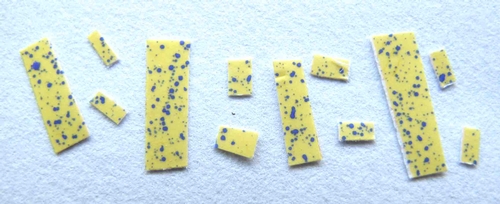
This is all fine and good, but now let us move from the mathematical theory to the reality of actual pesticide application. To begin, please consider the two photos provided by Ed Show which include strips of paper approximating lygus of two basic sizes, the longer being the 3/8" of an adult and the smaller approximating the size of a lygus nymph.
One can see very readily from this experiment that the problem with the mathematical theory is that of the assumption of perfect coverage of the lygus surface area with a thin sheet of water in my calculations, rather than using sprayed spaced droplets one can see in the second photo below. Clearly, the wider surface area has a higher probability of catching droplets than the smaller area, and the further apart the droplets tend to be, the lower the probability becomes of the smaller target getting hit with them. As a matter of fact, the droplets could be so far apart so as to even miss completely the smaller nymphal area, while delivering at least something of a dose to the adult.
With very, very closely spaced droplets, the greater the importance the surface area to mass ratio, but with droplets spaced more apart from one another the greater the importance of the surface area alone.
This comparison of the ideal and the practical argues heavily in favor of using lots of water carrier to create an abundance spray droplets, especially when dealing with a pest of small size. Water delivered in low gallonages and big droplets from low pressure delivery certainly packs more punch per droplet, but if it doesn't hit the target it will serve little purpose.

Blank spray paper approximately surface area of a lygus bug, the smaller being the nymph and the larger the adult. Photo courtesy Ed Show.
Applicator spray pattern. Notice how random pattern of droplets favors accumulation on a larger surface area. Photo courtesy Ed Show.
Major Mite Meeting Planned for June 27
This is a reminder that UCCE in Monterey County is holding a major meeting concerning mites in strawberries this coming June 27. Spanish translation will be offered.
Link to the agenda here:
http://cemonterey.ucanr.edu/files/166685.pdf
This is yet another extension meeting not to be missed.
I-AC-TSPP-AD
Case Studies of LBAM and EGVM: Community Perceptions of Emergency Responses to Invasive Species in California
I encourage readers of this blog to peruse the attached file, written by Margareta Lelea, a post-graduate researcher at UC Davis, with Frank Zalom, Jim Greishop and Jennifer Sedell. This study, funded by a Cooperative Agreement between the USDA (United States Department of Agriculture) and UC Davis, is a comparison of the emergency responses on the part of the USDA and CDFA (California Department of Agriculture) to the light brown apple moth (LBAM) and European grapevine moth (EGVM).
The experience of the LBAM emergency response was negative for many people on the Central coast of California. Seemingly dead set on the eradication of LBAM no matter what the cost, the USDA and the CDFA brooked very little community input as they attempted to put into place a program of aerial pheromone application accompanied by a quarantine regime composed of intrusive field inspections, disruption of farm business operations and costly field closures.
In contrast, the regulatory experience of EGVM emergency response was more positive for many (including me), and was a program which found its success in the working relationships between local regulatory officials, locally based USDA officials and agents (many of whom were already here for the LBAM program), UC Cooperative Extension and a diversity of other groups including growers and pest managers.
As one can draw from reading this report, that these two programs should have really different outcomes currently should then not be surprising.
The hugely unpopular LBAM emergency response program has had its budget virtually eliminated through the representative political process and has garnered a real distrust of the USDA and CDFA by the affected communities, which to some extent continues to this day.
LBAM continues to flourish on the Central Coast, although it still doesn’t cause a lot damage besides not being anything that can’t be managed easily with environmentally sensible methods. Nevertheless, LBAM still affects trade in a big way, the current situation being a threatened closure of our Canadian and Mexican export markets for berries or broccoli should LBAM arrive there in any shipment of either of these commodities.
In contrast, EGVM has been eradicated following its brief appearance in Santa Cruz County in 2011 and its numbers have been dramatically lowered in other infested areas such as Napa, Sonoma and the Central Valley.
The attached paper does a first class job in outlining and comparing LBAM and EGVM emergency responses and shows us what we and the regulatory agencies can learn from these two experiences to guide us in the future.
Some key takeaways from the paper:
1- Agencies lose credibility and trust from communities when they undertake actions against the will of the people. This the USDA and CDFA did in spades on the LBAM emergency response, pushing ahead while initially ignoring many community concerns about their activities and creating a perception of an abuse of science and government power.
2- Agencies gain credibility and trust through a willingness to engage and effect change, which includes responding to the needs of the communities and the environment and adapting new information from science as appropriate. This was clearly the case with EGVM, as USDA and CDFA agents (many of whom were also involved in LBAM programs) worked together with local regulators, UC Cooperative Extension and growers to arrive at a workable, successful solution to the issue.
3- Aerial spray programs must be enacted only with the support of affected communities.
I guess what I think about after reading through this report is how did the LBAM emergency response go so awry? Most of the USDA and CDFA people involved in the response are very competent, decent people who truly want to serve the public and the agricultural industry in the best possible way.
Have these agencies become bureaucracies, who, to quote the philosopher Ludwig von Mises, “are no longer eager to deal with each case to the best of their abilities; they are no longer anxious to find the most appropriate solution for every problem” and whose “main concern is to comply with the rules and regulations, no matter whether they are reasonable or contrary to what was intended."? I would today answer in the negative, because even if the USDA and CDFA started out behaving as the bureaucracies described by von Mises, they both seem to have learned from their experience and turned the corner pretty promptly. Indeed, that both seemed to undergo pretty well a paradigm shift in their approach on the EGVM emergency response just a few years later after the difficult start on LBAM is a testament to their ability to learn and evolve to best serve the publics who have entrusted them to keep invasive pests out of California.
Kudos to a really thought provoking and illuminating report by Dr. Lelea and her colleagues about two signal invasive pest responses. A must read for entomologists, regulators and pest managers on the Central Coast.
Slime Molds
Slime molds, classified in the group called Myxomycetes, are primitive fungi that feed on dead or decaying organic matter and have elaborate life cycles. The mature fruiting bodies of slime molds are quite diverse and can appear as sheets, mounds, crusts, blobs, and even eggs or structures of insects (Photo 1).
Occasionally, slime molds can be found growing incidentally around or on crops. The pictures below are of the slime mold Fuligo septica that is emerging from the bark mulch of a local blueberry field. The immature stage (Photo 2) is yellow, without distinct shape, and has a sticky, gooey feel when touched. This is the form that one finds oozing and moving onto organic material. When mature, a tan to off-white, crusty calcium layer forms on the top of the creeping mass (Photo 3). When fully mature and dried, the calcium layer breaks, exposing and releasing millions of brown spores.
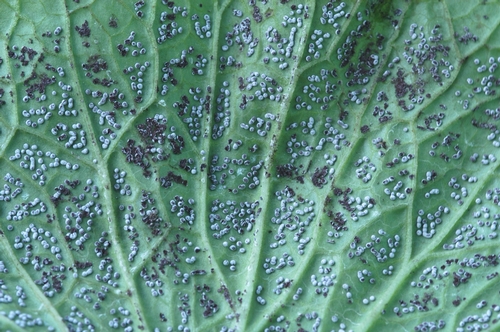
Slime molds can also grow onto living plant parts and appear to cause a disease. Photos 4 and 5 show a slime mold growing on top of strawberry leaves; photo 6 shows slime mold colonization on a wasabi leaf. However, it is important to emphasize that slime molds are completely saprophytic, meaning they feed on dead organic material only. Slime molds therefore do not present any harm to plants.
Slime molds will only develop if there is sufficient organic matter present to feed the fungus and if there is ample and consistent moisture to allow it to develop. For these reasons, slime molds are rarely seen in cultivated fields but are more common in forests, shaded landscape areas, and lawns.
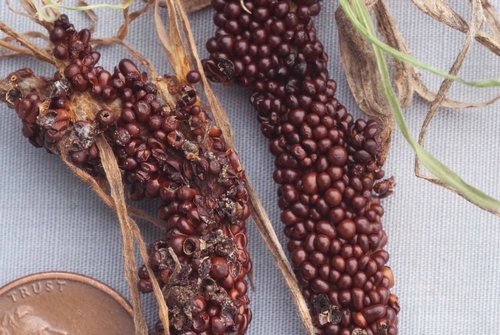
Some slime molds, such as this species growing on a grass, may resemble insect eggs or bodies. Photo courtesy of Steven Koike, UCCE.
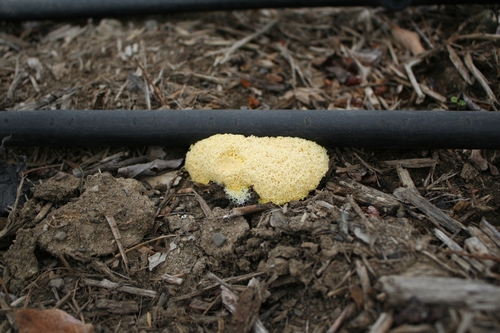
Immature stage of slime mold. Photo Mark Bolda, UCCE.
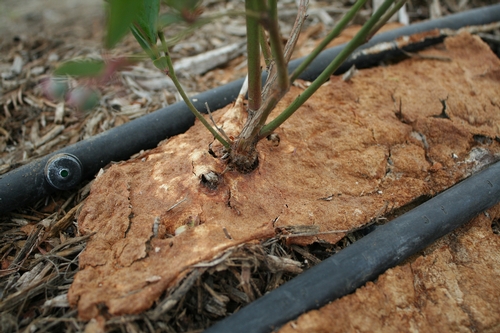
Mature form of slime mold around blueberry stem. Note that surface is starting to crack and expose spores for release. Photo Mark Bolda, UCCE.
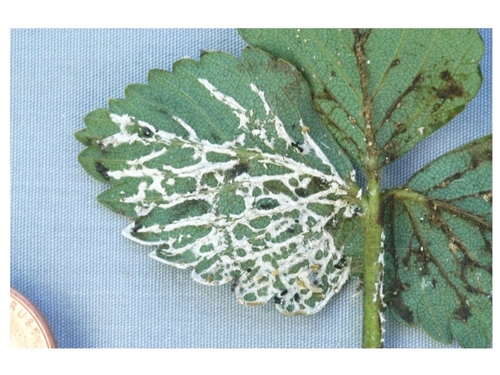
Slime mold on strawberry leaf. Photo courtesy Steven Koike, UCCE
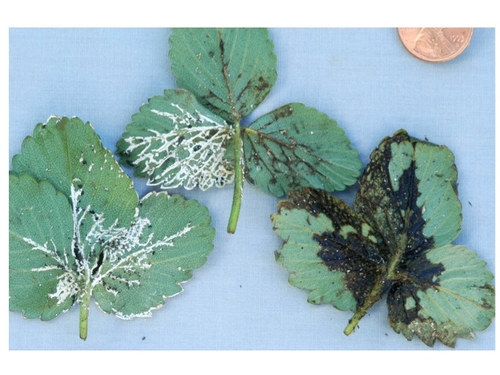
Slime mold on strawberry leaf. Photo courtesy Steven Koike, UCCE.
Slime mold colonization of wasabi leaf. Photo courtesy Steven Koike, UCCE.
